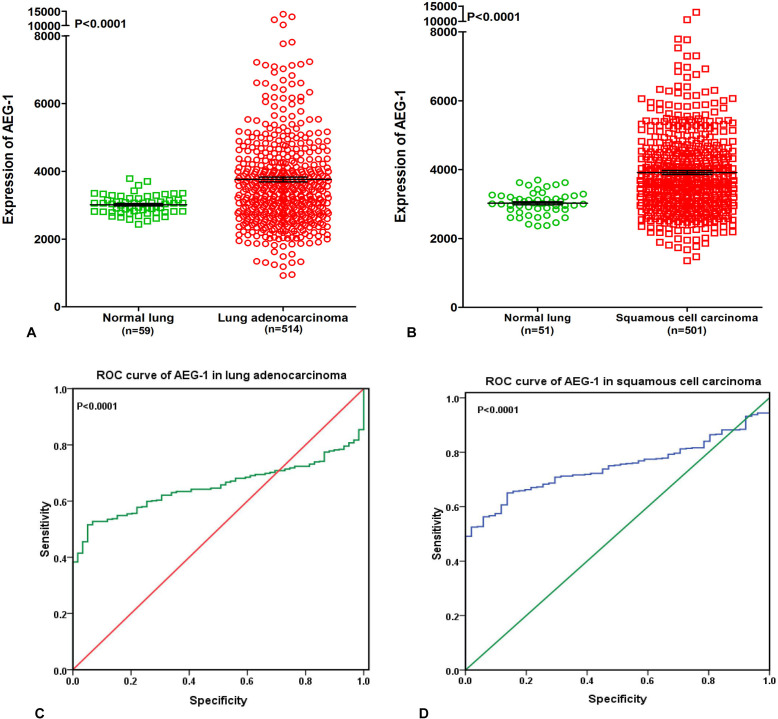
Figure 2. Supplementary information from The Cancer Genome Atlas (TCGA) database.
(A) AEG-1 was highly expressed in lung adenocarcinoma compared to the non-cancerous lung tissues based on The Cancer Genome Atlas (TCGA) database (P < 0.0001). (B) AEG-1 was highly expressed in squamous cell carcinoma compared to the non-cancerous lung tissues based on The Cancer Genome Atlas (TCGA) database (P < 0.0001). (C) ROC curve analyses of AEG-1 for predicting the clinical diagnostic value in lung adenocarcinoma patients based on The Cancer Genome Atlas (TCGA) database. The area under curve (AUC) of AEG-1 was 0.650 (95%CI 0.607∼0.694, P < 0.0001), which indicates a certain diagnostic value of AEG-1 level in lung adenocarcinoma. (D) ROC curve analyses of AEG-1 for predicting the clinical diagnostic value in squamous cell carcinoma patients based on The Cancer Genome Atlas (TCGA) database. The area under curve (AUC) of AEG-1 was 0.746 (95%CI 0.702∼0.789, P < 0.0001), which indicates a potential diagnostic value of AEG-1 level in squamous cell carcinoma.

