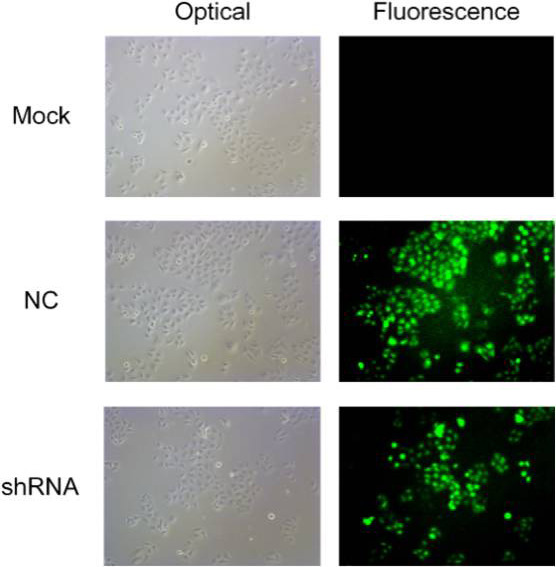
Figure 8. The immunofluorescence images of the AEG-1 staining in the different groups.

ShRNA plasmids were transfected into three groups (mock control, NC and shRNA). The results of immunofluorescence images show that the expression of AEG-1 was inhibited in the shRNA group with the transfection rate being approximately 80%.
