
Figure 3. Transcriptional aberrations observed in RBPs in GBM.
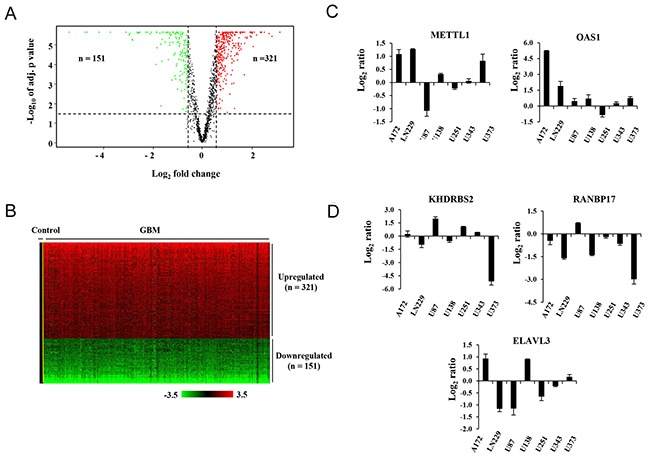
(A) Volcano plot representing upregulated (red dots), downregulated (green dots) and unregulated (black dots) RBPs in GBM samples (n = 572) as compared to control samples (n = 10) using TCGA data. The horizontal dotted line demarcates the genes having significant expression difference (p-value < 0.05). Vertical dotted lines represent the applied cut off (absolute fold 1.5) for identifying differentially regulated genes. (B) Heat map of the 472 differentially expressed RBPs in GBM samples when compared to control brain samples. A dual-color code was used, with red and green indicating upregulated and downregulated RBPs, respectively. 321 RBPs were found to be upregulated and 151 RBPs were found to downregulated in GBM compared to control samples. The yellow line separates control samples from GBM samples. (C, D) Transcript levels (in Log2 ratio) of selected upregulated (C) and downregulated genes (D) in the mentioned glioma cell lines relative to Immortalized Human Astrocytes (IHA).