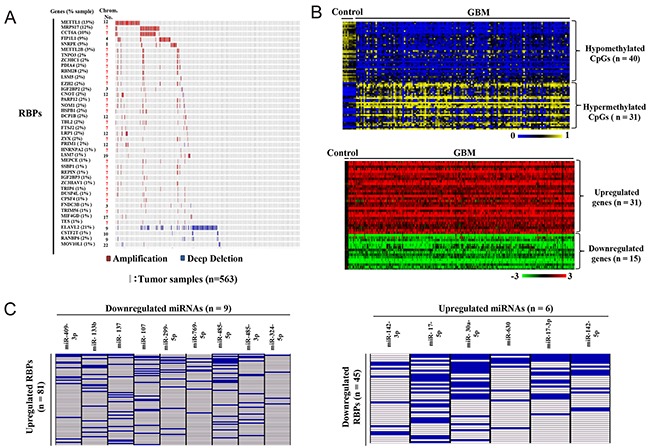
Figure 4. Probable causes for aberrant expression of RBPs in GBM.

(A) Graphical representation of RBPs with copy number variation in GBM samples compared to control samples. The samples in red and blue indicate the RBPs that are amplified and deleted respectively. The numbers in brackets indicate the percentage of samples in which a particular RBP had CNVs. The chromosomal location of a particular CNV is also indicated. (B) Heat maps representing the selected differentially expressed RBPs which are also differentially methylated. A dual-color code was used for methylation related heat map (top), wherein blue and yellow indicate hypomethylated CpGs and hypermethylated CpGs respectively corresponding to the upregulated and downregulated genes shown in dual color (red-green) expression related heat map (bottom). A dual-color code was used for expression related heat map, wherein red and green indicate upregulated and downregulated RBPs respectively. Their expression pattern in GBM versus control samples is shown in the heat map in the bottom panel, while their corresponding differentially methylated CpGs are represented in the heat map in the top panel. (C) Tabular representation of RBPs and the putative targeting miRNAs. Differentially regulated miRNAs predicted to target both upregulated and downregulated RBPs were identified using miRwalk. Only those miRNAs which were predicted to target the input differentially regulated RBP in seven or more than seven algorithms in miRwalk and having reciprocal regulation as compared to targeted RBPs are represented here. The blue boxes indicate the predicted miRNA-RBP targeting pair, while white boxes correspond to non-targeting miRNA-RBP pairs. Left: Upregulated RBPs predicted to be targeted by downregulated miRNAs; right: downregulated RBPs predicted to be targeted by upregulated miRNAs.
