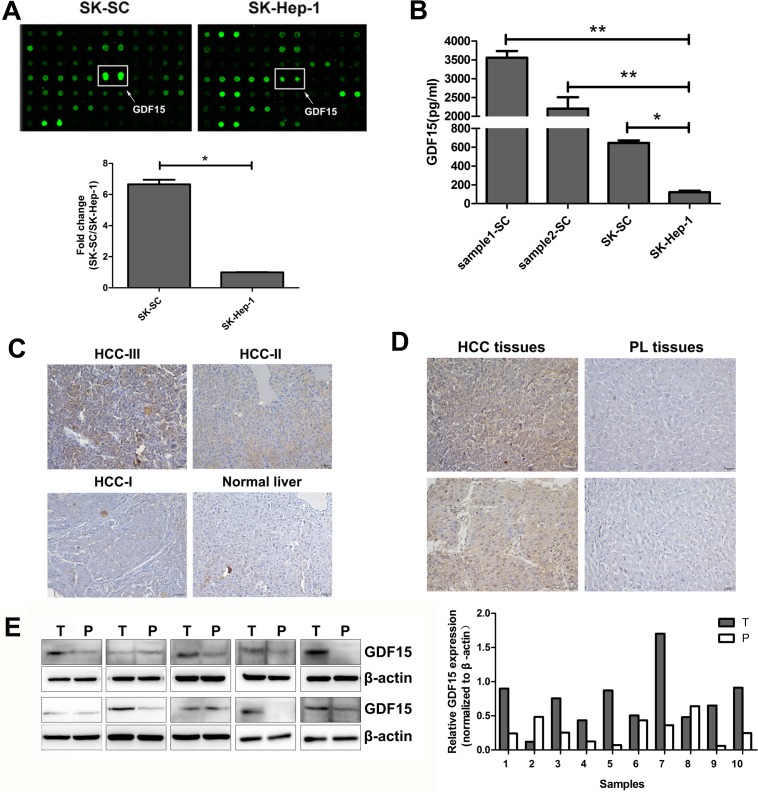
Figure 3. GDF15 is highly expressed in three groups of SCs and HCC tissues.
(A) Cytokine antibody arrays of cytokine expression in culture supernatants of SK-SC and SK-Hep1 cells. GDF15 expression in SK-SCs and SK-Hep-1 cells was detected by cytokine antibody array. The data are shown as the means ± SD (n = 3). *: compared with SK-Hep-1 cells, P < 0.05. (B) Sample1-SCs, sample2-SCs, SK-SCs and SK-Hep-1 cells were incubated in serum-free media for 48 hours. GDF15 concentration was determined using ELISA in media from cells. The data are shown as the means ± SD (n = 3). *: compared with SK-Hep-1 cells, P < 0.05; **: compared with SK-Hep-1 cells, P < 0.01. (C) A HCC tissue array consisting of HCC samples with different grades of malignancy and normal liver samples was stained for GDF15. Representative results are shown. Scale bar: 50 μm. (D) GDF15 expression in HCC and PL tissues from two patients was determined by IHC. Scale bar: 50 μm. (E) GDF15 protein expression in HCC (T) and PL (P) lysates was determined by western blot analysis. Relative protein intensities were detected by Image J software. β-Actin was used as a loading control.

