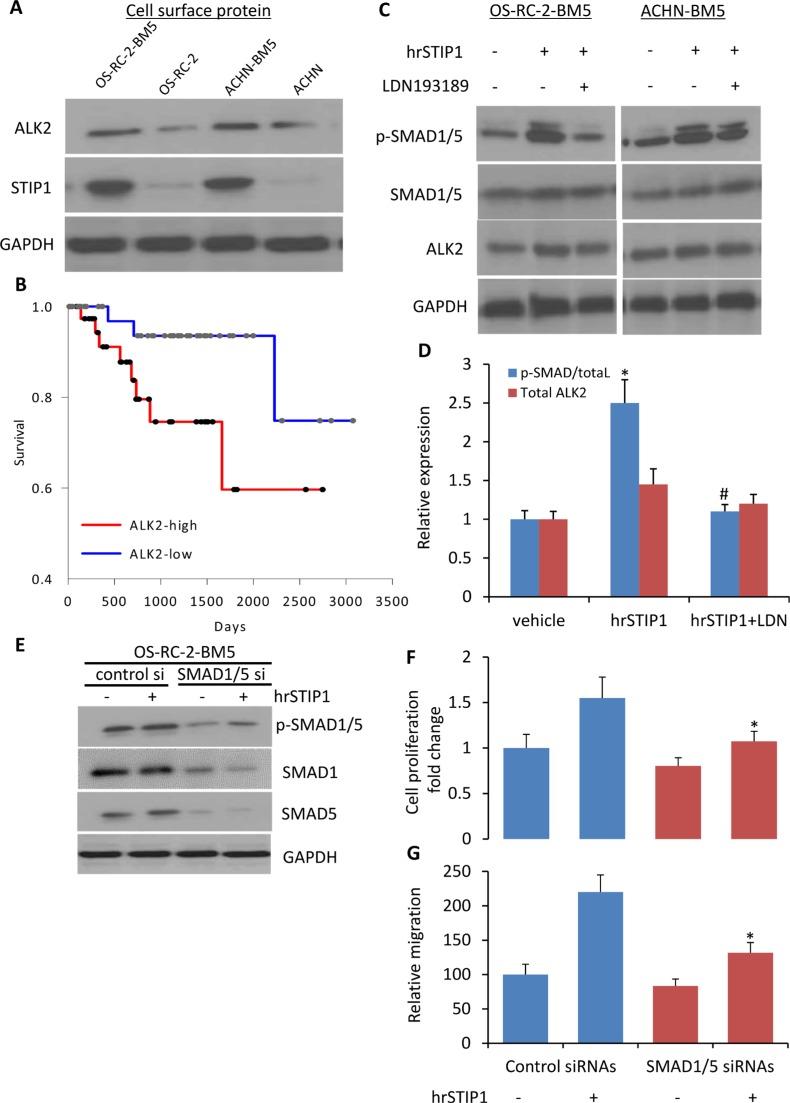
Figure 6. Activation of STIP1-ALK2-SMAD1/5 signaling in bone metastatic RCC tumor cells.
(A) ALK2 expression was examined in the cell surface protein of indicated cell lines. (B) The Kaplan-Meier curve for overall survival of the TCGA RCC cohort (n = 88) on the basis of ALK2 mRNA level. Patient was determined as ALK2-high or –low group when the ALK2 expression value was above or below the mean value in the dataset. The survival distributions were estimated by the Kaplan-Meier method, and the significance of differences between survival rates was ascertained using the log-rank test. (C) Expressions of p-SMAD1/5, SMAD1/5, ALK2 in the total cell lysate from indicated cell lines upon hrSTIP1 and/or LDN193189, or corresponding vehicle treatment. (D) Quantification of the western blot analysis (C) with three repeats. Expression of p-SMAD1/5 was normalized to the level of total SMAD1/5, and ALK2 expression was normalized to the level of GAPDH. *p < 0.05, vs vehicle; #p < 0.05, vs hrSTIP1. (E) Knockdown of endogenous SMAD1 and SMAD5 by siRNA decreased the stimulation of pSMAD1/5 protein levels by treatment with 500 nM hrSTIP1. F-G. Suppression of endogenous SMAD1/5 by siRNAs decreased the 96-h proliferation (F) and 24-h migration (G) of OS-RC-2-BM5 cells under treatment with 500 nM hrSTIP1. Results shown are the mean ± SE from three independent experiments. *p < 0.05, vs control siRNAs + hrSTIP1.

