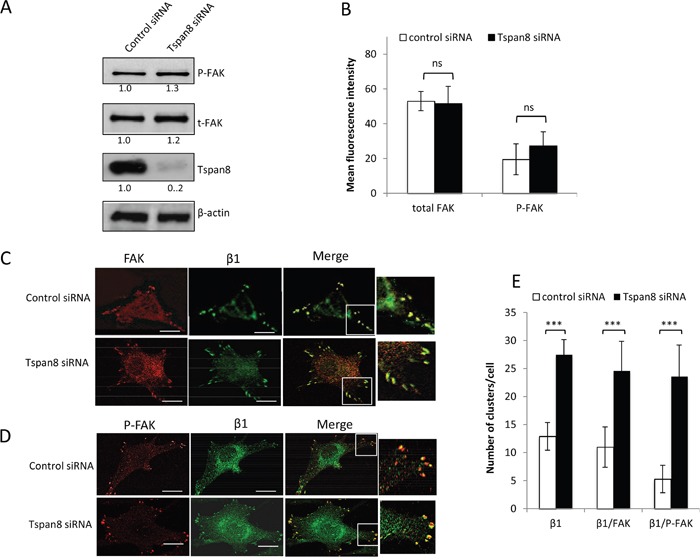
Figure 4. Tspan8 regulates β1 integrin clustering but does not affect phosphorylation state of FAK.

A and B. T1C3 cells transfected with control or TSPAN8 siRNAs were seeded on collagen IV-coated plates and subjected to western blot (A) and flow cytometry (B) for analysis of total FAK (t-FAK) and phospho-FAK (P-FAK) expression level. (A) Bands intensities were quantified and normalized to that of β-actin (representative of 3 independent experiments). (B.) The value represents the mean MFI ± SD of three independent experiments. C-E. T1C3 cells silenced or not for Tspan8 were plated onto collagen IV-coated coverslips and costained with FAK (red) and 12G10 (green) mAbs or P-FAK (red) and 12G10 (green). (C and D). The merged representative confocal image shows colocalization (yellow). Inset, enlarged areas of peripheral adhesion staining. Scale bar is 10 μm. (E). The number of clusters per cell containing active β1 integrin colocalized or not with FAK was quantified. Data shown represent the mean ± SD for at least 45 cells per experimental group encompassing at least three independent experiments.
