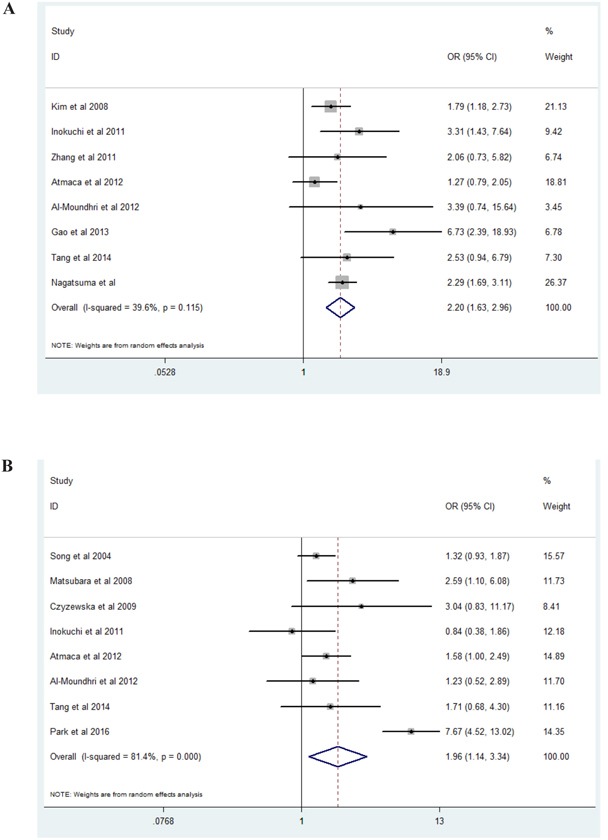
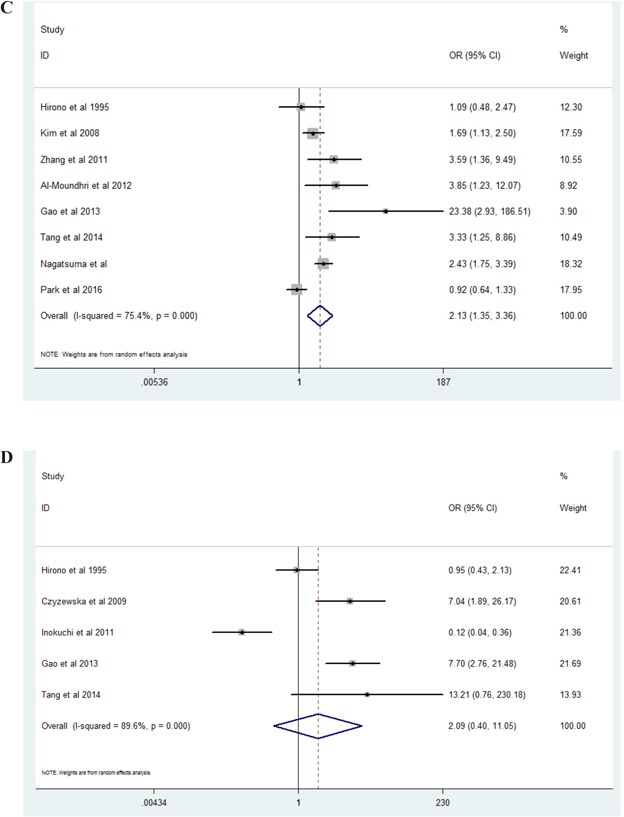
Figure 2. Forest plots of studies evaluating the correlation between EGFR expression and pathological parameters.


A. Lymph node metastasis (present vs absent); B. Tumor differentiation (poor vs well/moderate); C. Tumor stage (I-II vs III-IV); D. Invasion depth (present serosal invasion vs absent serosal invasion).
