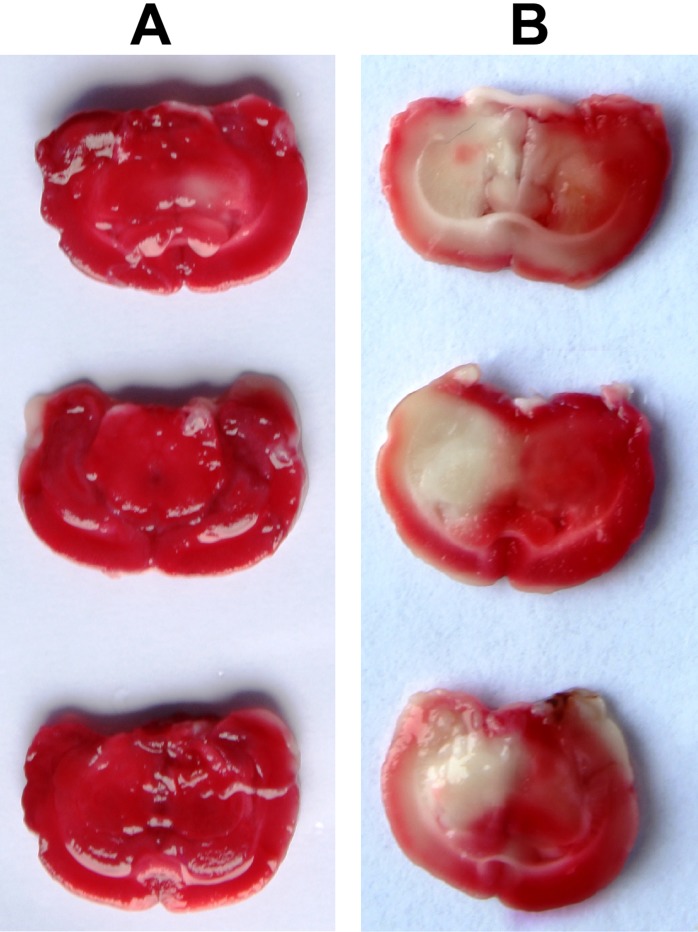
Figure 1.
Comparison of ischemic infarct area between the control group and DM + CI group by TTC staining (A, Ischemic infarct area in the control group; B, Ischemic infarct area in the DM + CI group. Normal tissues were in red and ischemic infarct areas were in pale white. Compared with the control group, the DM + CI group had more ischemic infarct area)Notes: TTC, triphenylte-trazolium chloride; DM, diabetes mellitus; CI, cerebral infarction.

