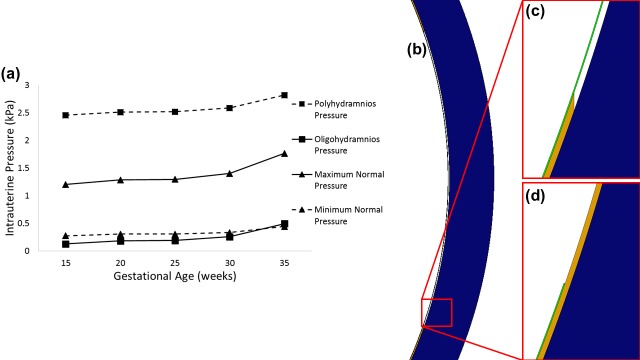
Fig 2.
(a) Graph of previously reported or calculated changes in maximum and minimum intrauterine pressure [37], and intrauterine pressure during polyhydramnios and oligohydramnios calculated from [45], over gestation. Diagram showing a partitioned membrane model with (b, c) a section of chorion removed, and (d) a section of amnion removed.

