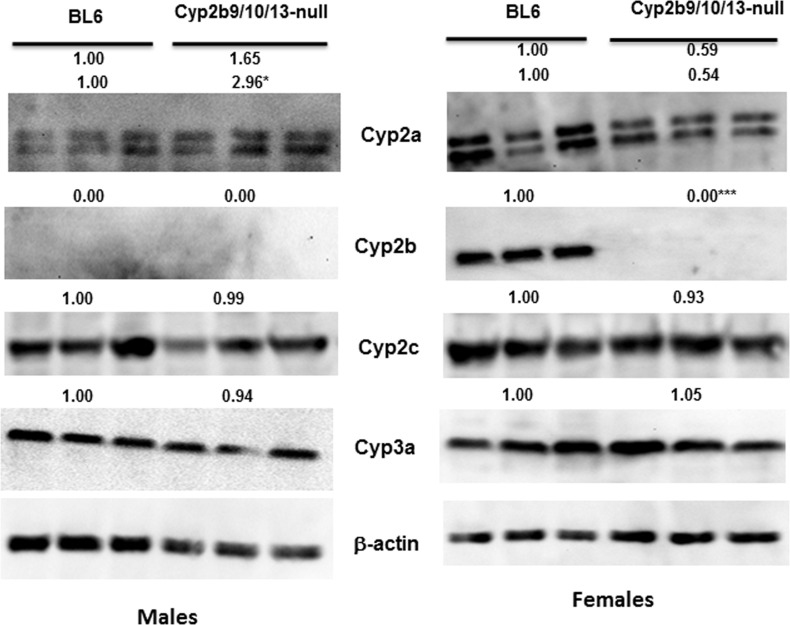
Fig 6. CYP protein expression in WT and Cyp2b9/10/13-null mice.
Western blots of male and female Cyp2b9/10/13-null mice show significant changes in CYP expression relative to their WT counterparts. Cyp2a isoforms show two bands as Cyp2a22 is 50kDa in B6 mice and the other Cyp2a isoforms are 56 kDa. Results are expressed as relative mean of the WT compared to CAR-null mice of the same sex. Statistical differences were determined by Student’s t-tests (n = 3) with * (p < 0.05) *** (p < 0.001) indicating significant differences.

