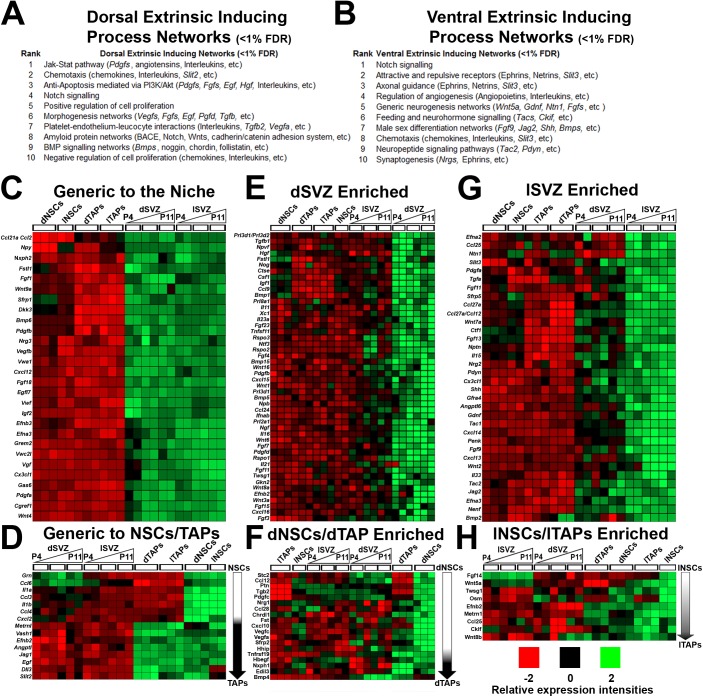
Fig 1. Spatial expression profiles of secreted signaling factors in subventricular zone (SVZ) microdomains.
(A, B) Significantly filtered genes in each region-derived sample were analyzed on GeneGo Metacore for process networks and ranked numerically according to their false discovery rate (FDR) significance (<1%). NB: process networks categories were shortened to fit. (C, D) Heatmaps of genes generic and stable within microdomains across the varied time points are plotted, including those common in isolated neural stem cells (NSCs)/transient amplifying progenitors (TAPs) (D). (E-G) Heatmaps of genes enriched in region-specific microdomains (generally stable temporal expression) versus the adjacent microdomain and NSCs/TAPs. The same was performed for region specific NSCs/TAPs (F, H). Note: the overlapping expression profiles for region-specific NSCs with TAPs. dNSCs, dorsal NSCs; dTAPs, dorsal TAPs; dSVZ, dorsal SVZ; lNSCs, lateral NSCs; lTAPs, lateral TAPs; lSVZ, lateral SVZ.

