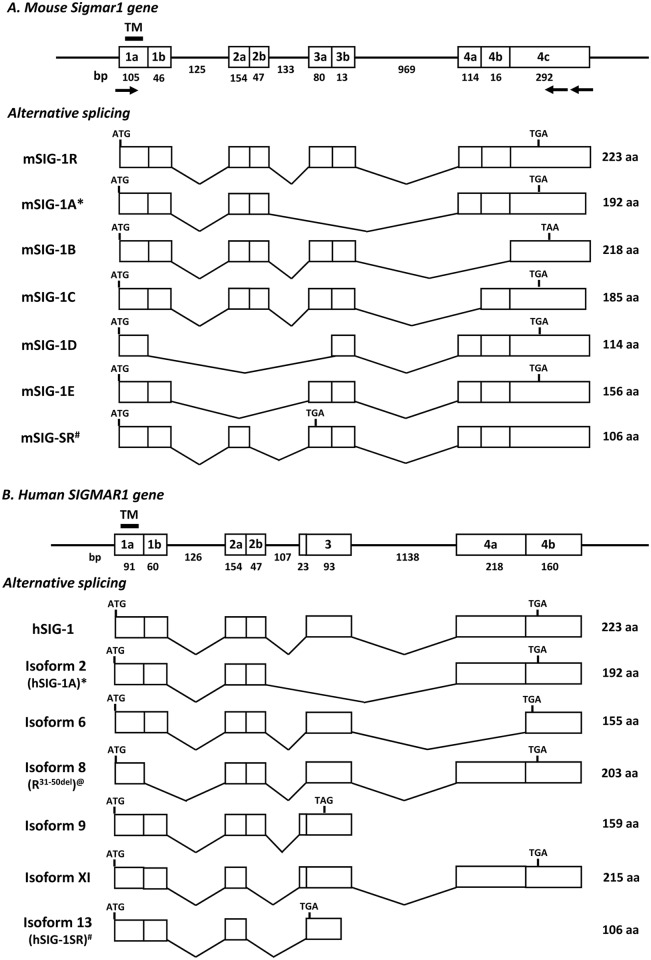
Fig 1. Schematic of the sigma1 receptor gene structure and alternative splicing.
A). The mouse sigma1 receptor gene (Sigmar1). B). The human sigma1 receptor gene (SIGMAR1). Exon and introns are showed by boxes and horizontal lines, respectively. The predicted transmembrane domain is encoded by exon 1a and indicated by a short heavy line. Arrows represent primers used in PCR cloning. Translational start (ATG) and termination codons (TGA or TAA or TAG) are shown at indicated exons. The sizes (bp) of exons and interns are shown below the boxes and lines. The number of the predicted amino acids in each variant is listed at right. * & #: similar splice variants in both mouse and human [27, 28]; @: a human variant reported from literature [29].

