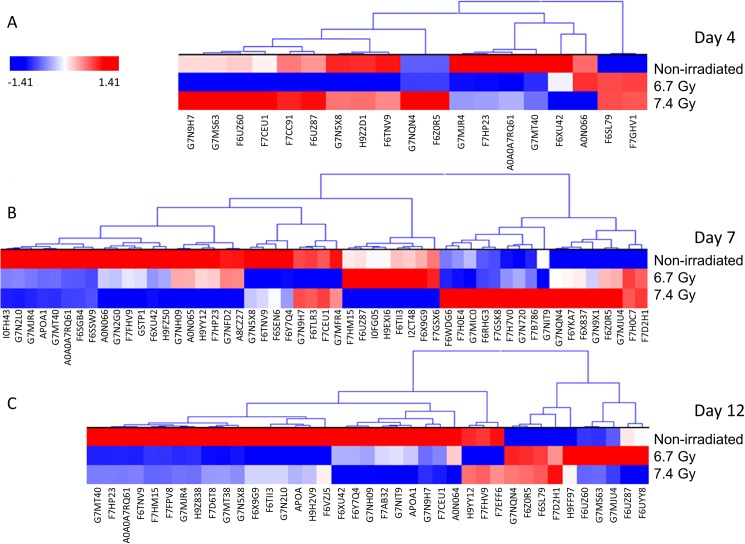
Fig 3.
Hierarchical cluster of significantly differentiating proteins in a dose dependent manner from days 4 (A), 7 (B), and 12 (C) post-irradiation. Proteins were clustered using the average linkage method and Euclidean distance metric. Proteins were considered significant by Kruskal-Wallis p-value corrected using Benjamini-Hochberg. Red indicates elevated levels, while blue indicates lower levels of the given protein.

