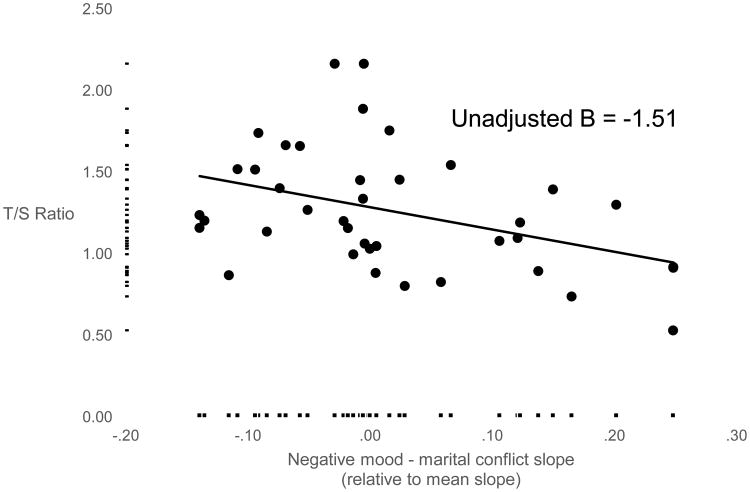
Figure 1.
Scatterplots depicting the association between negative mood - marital conflict slope and LTL. Dots correspond to the scatterplot, and markers along the X- and Y-axes indicate the distribution of the X- and Y- variables. LTL was indexed by the ratio of relative telomere (T) gene expression to single copy (S) gene beta hemoglobin expression (T/S ratio). One LTL outlier greater than M + 3 SD was winsorized to the 95%ile. Outliers for all independent variables were winsorized to the 95%ile. The unstandardized, unadjusted B is also shown in Table 2.

