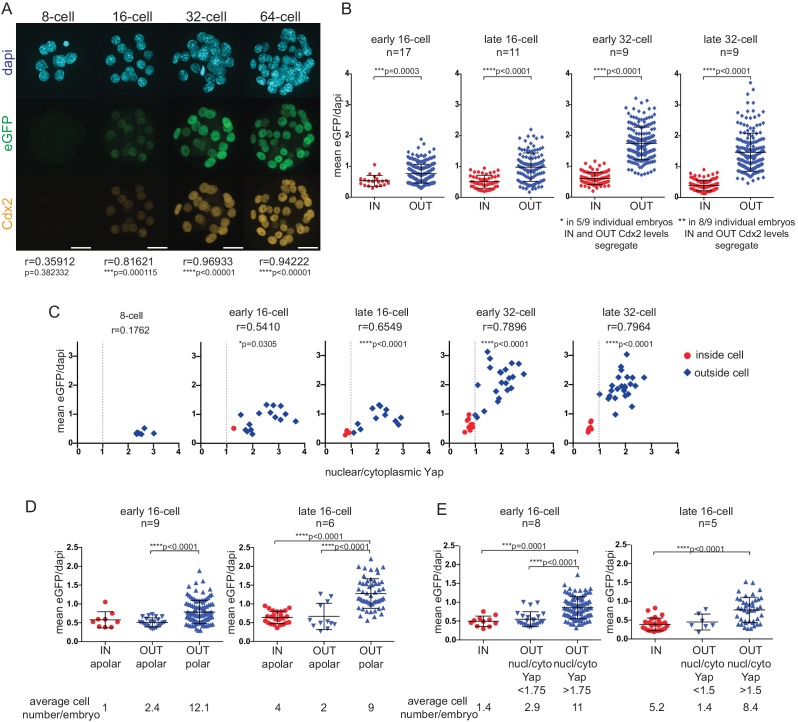
Figure 1. Cdx2-eGFP is an early marker of the developing TE lineage, governed by Hippo signaling differences from the early 16 cell stage.
(A) Immunofluorescence staining against Cdx2 and eGFP in Cdx2-eGFP heterozygous embryos at different stages. Representative images of 10 8 cell, 39 16 cell, 35 32 cell and 11 64 cell embryos stained and imaged in two independent experiments. Scale bar: 25 μm. Correlation between eGFP and endogenous Cdx2 signals was calculated by measuring fluorescence intensities in individual cell nuclei and performing Pearson’s correlation (r indicates coefficient). p-values are also given for each embryonic stage. (B) Mean fluorescence intensity of eGFP (Y-axis) in individual inside and outside cell nuclei of different stage Cdx2-eGFP embryos. Position was determined by co-staining embryos with phalloidin (F-actin) and cells with any surface membrane exposure were classified as outside. n indicates number of embryos. * and ** note how eGFP/Dapi measurements segregate in individual embryos. Statistical significance was calculated by Mann-Whitney test and significant p-values are indicated. Error bars: s.d. of mean. (C) Mean eGFP intensity relative to nuclear/cytoplasmic Yap ratio in individual inside (red) and outside (blue) cells in Cdx2-eGFP embryos at different stages. Representative measurements from 5 8 cell, 8 early 16 cell, 5 late 16 cell, 5 early 32 cell and 4 late 32 cell embryos are shown. All embryos were stained and imaged in one experiment. Correlation was calculated using Pearson’s correlation (r indicates correlation coefficient) and p-value is given. (D–E) Mean fluorescenceintensity of eGFP (Y-axis) in single cells in different cell populations, in early and late 16 cell stage Cdx2-eGFP embryos. (D) Inside apolar, outside apolar and outside polar cell populations. (E) Inside cells, outside cells with low nuclear/cytoplasmic Yap ratio and outside cells with high nuclear/cytoplasmic Yap ratio. Polarity was determined by phospho-ezrin staining. n indicates number of embryos analyzed. Statistical significance was calculated by Kruskal-Wallis test and significant p-values are indicated. Error bars: s.d. of mean. Cells in M-phase are not included.


