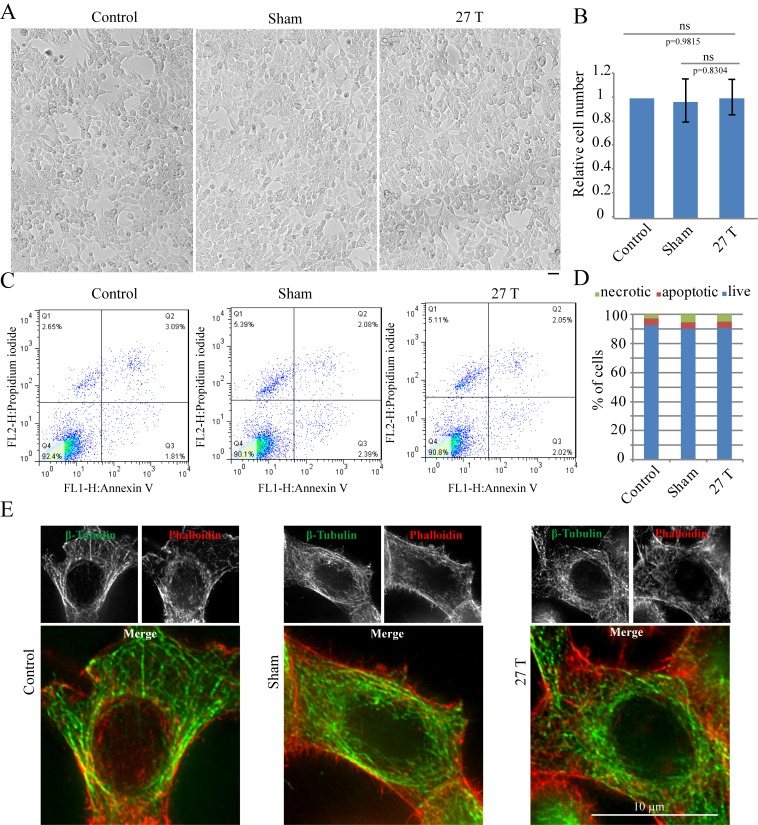
Figure 2. 27 T Ultra-high magnetic field does not have immediate cytotoxicity effects in CNE-2Z cells.
CNE-2Z cells were plated directly on 18 mm tissue culture plate or coverslips in the18 mm tissue culture plate one night ahead to allow the cells to attach. On the day of experiment, they were placed in regular full-sized cell incubator (control) or the sample incubators in sham or in 27 T magnet for 4 hr before they were taken out and subjected to the following analysis. (A) Representative bright field images and of control, sham and 27 T SMF treated CNE-2Z cells. Scale bar: 20 μm. (B) Quantification of cell numbers in control, sham and 27 T SMF treated CNE-2Z cells from three independent experiments (n = 3). Data is mean ± SD. ‘ns’, not significant. (C) Flow cytometry results of CNE-2Z cells treated with control, sham or 27 T for 4 hr and dual staining with annexin V and PI. Bottom left leaflet shows the live cells that have intact cell membrane and have negative staining for both dyes. Top left leaflet shows necrotic cells. Right parts show apoptotic cells. (D) Quantification of cell numbers in each population. (E) Immunofluorescence of CNE-2Z cells shows that 27 T SMF does not have obvious effects on microtubule and actin cytoskeleton in interphase cells. CNE-2Z cells were fixed and stained with anti-tubulin antibody and fluorescently labeled phalloidin for microtubules (green) and actin (red) cytoskeleton. Experiments have been repeated for three times and representative images are shown in the figure. Scale bar: 10 μm.
DOI: http://dx.doi.org/10.7554/eLife.22911.005


