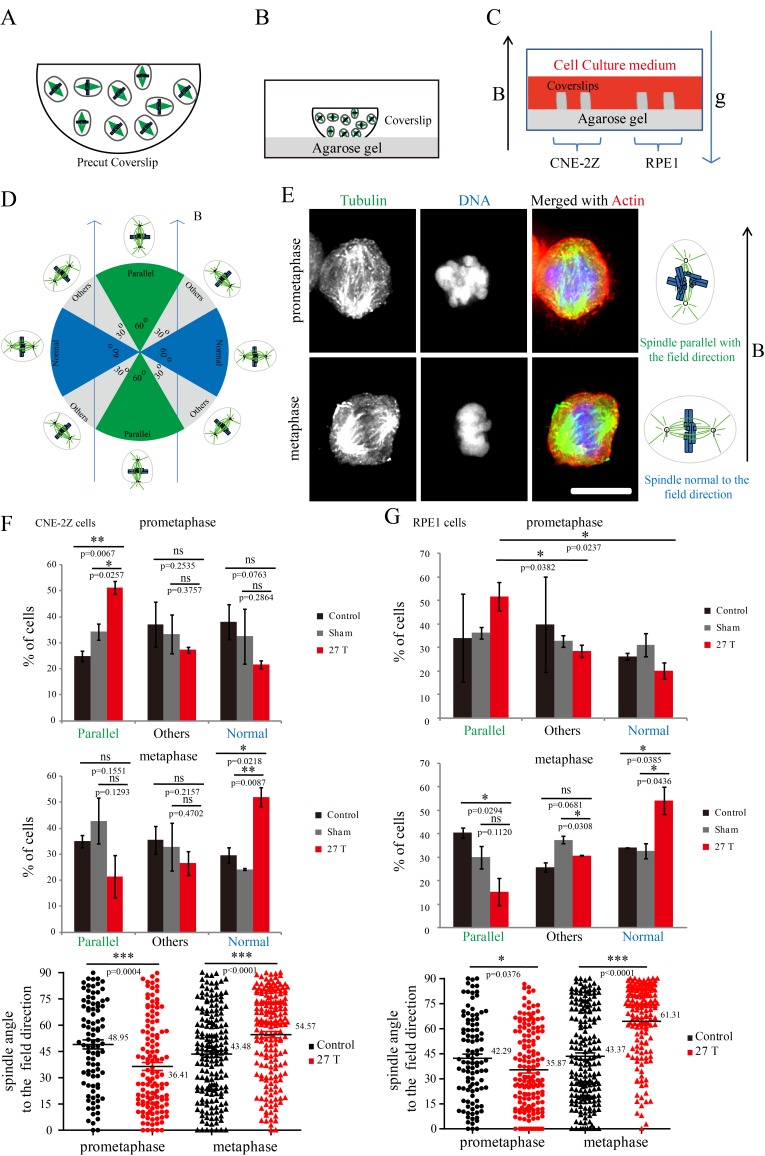
Figure 5. Prometaphase and metaphase spindles have different orientations in 27 T SMFs.
(A–C) Schematic illustration of the experimental set-up. (A) CNE-2Z and RPE1 cells were plated on pre-cut coverslips one night ahead to allow the cells to attach. (B) On the day of experiment, the coverslips were inserted onto agarose gel in the 18 mm plates. (C) Cells were treated with or without synchronization, and with or without 27 T magnetic field for 4 hr before they were fixed and stained with anti-tubulin antibody (for microtubules) and fluorescently labeled phalloidin (for actin polymer) and DAPI (for DNA). ‘B’ shows the magnetic field direction and ‘g’ shows the gravity direction. (D) The orientation of the spindle long axis was measured and characterized into ‘parallel’ (green), ‘normal’ (blue) and ‘others’ (grey) according to the angle between spindle long axis and the magnetic field direction. (E) Representative immunofluorescence images of prometaphase and metaphase RPE1 cells that have different orientation when they were exposed to 27 T SMF for 4 hr. Scale bar: 10 μm. (F, G) Quantification of prometaphase and metaphase spindle orientations in control, sham or 27 T treated CNE-2Z (F), and RPE1 (G) cells. One experiment was done in synchronized cells and the other was done with unsynchronized. Total of 1575 spindles were measured from four independent coverslips from two independent experiments. The histograms were created in excel (mean ± SD). Scatter plots were created in GraphPad (mean ± SEM). *p<0.05, **p<0.01, ***p<0.005.
DOI: http://dx.doi.org/10.7554/eLife.22911.017


