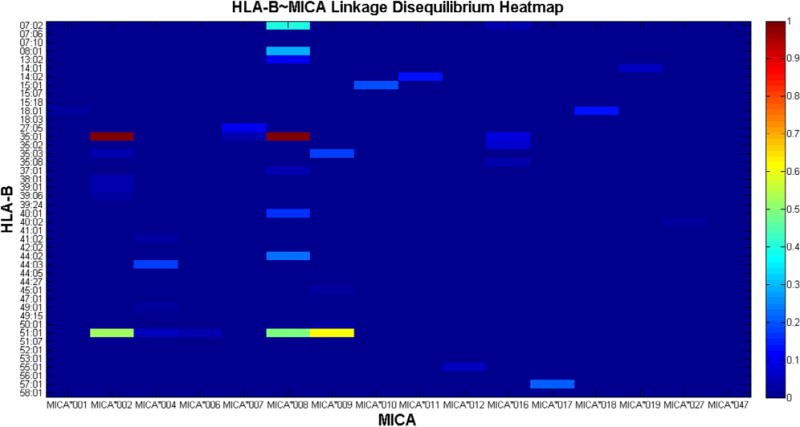
Figure 1.

Heat map of MICA~HLA-B haplotype linkage disequilibrium (LD) expressed in terms of the D′ measure. The abscissa and ordinate represent MICA and HLA-B alleles respectively. The right color-bar represents the range of D′ (0–1). Cool colors represent lower values of D′ while warm colors demonstrate high haplotype LD. (This figure is available in color online at www.bbmt.org.)
