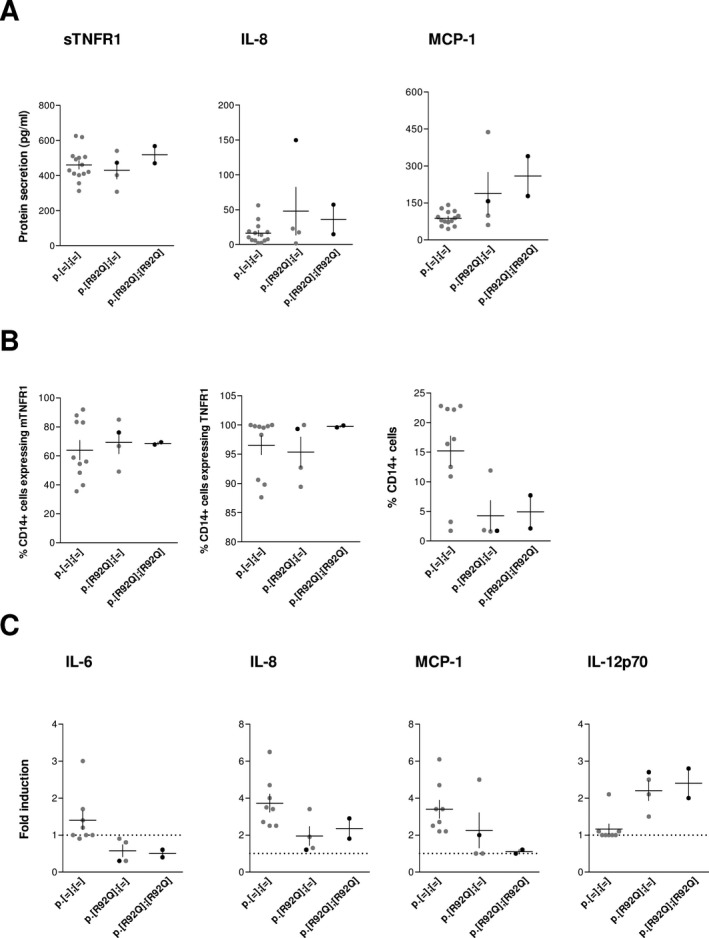
Figure 2.

Functional effect of the number of R92Q variants on inflammatory responses. (A) Inflammatory biomarkers in plasma samples. The concentration of sTNFR1, IL‐8, and MCP‐1 was measured by ELISAs. The asymptomatic and symptomatic individuals in each group are denoted by gray and black dots, respectively. The levels were compared according to the number of R92Q variants. The mean and SEM of each genotype group is represented by horizontal and vertical lines, respectively. (B) TNFR1 expression in monocytes. The CD14 + cells expressing the membrane (mTNFR1, left) and intracellular (middle) TNFR1 and the relative percentage of CD14 + cells (right) are quantified by flow cytometry in PBLs. The data are represented as indicated in A. (C) Ex vivo cytokine production in response to TNF. PBLs were incubated in complete medium alone or with TNF. After incubation, the cytokine concentrations were quantified by ELISAs. The fold induction of each cytokine relative to spontaneous production in the absence of TNF is shown. Data were analyzed and denoted as in A. The horizontal dot line denotes a fold induction of one, which is indicative of no variation in cytokine production.
