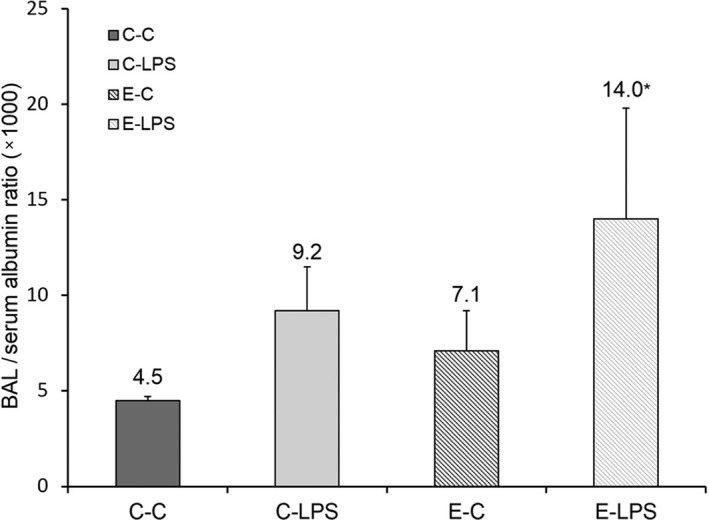
Figure 5.

Bronchoalveolar lavage/serum albumin ratio (1000). C‐C, control; C‐LPS, normal lung with sepsis; E‐C, emphysema without sepsis; E‐LPS, emphysema with sepsis. Values are shown as means and standard deviation. Statistical analysis was performed using Kruskal–Wallis test followed by Mann–Whitney U‐test. Adjustments for repeated measures were made according to the Bonferroni correction. *P < 0.05 compared with C‐C.
