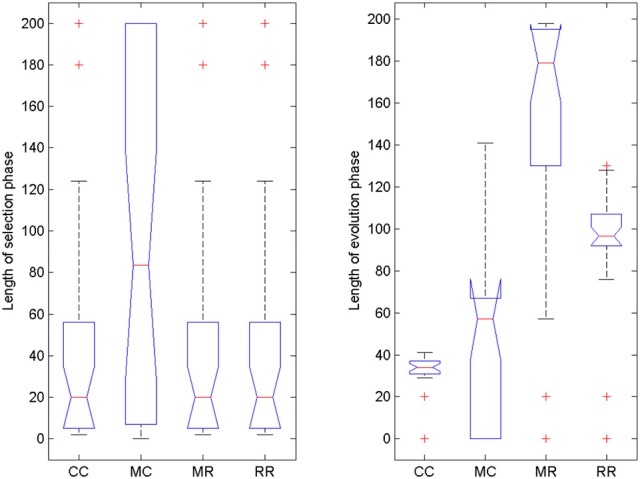
Figure 11.

Length of selection phase and evolution phase in the four conditions of Experiment 3. On each box, the central mark is the median, the edges of the box are the 25 and 75 percentiles, the whiskers extend to the most extreme data points not considered outliers and outliers are plotted individually (red +). Notches represent comparison intervals: two medians are significantly different at the 5% significance level if their intervals do not overlap.
