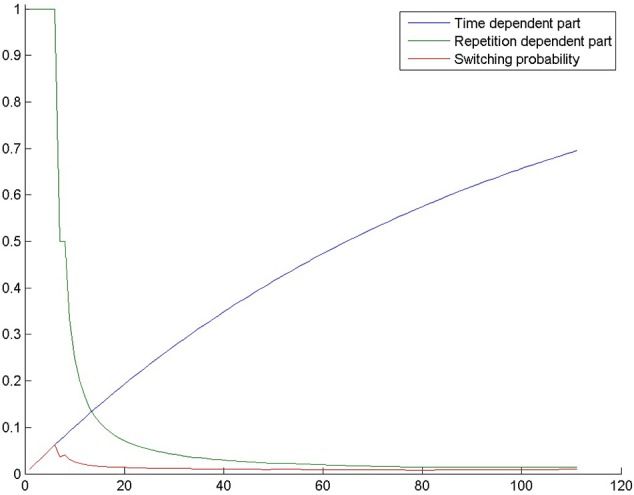
Figure 2.

The probability of switching from selection mode to evolution mode in a simulation in the control condition of Experiment 2. The blue curve shows 1−ab*g, where g is the number of generations, a = 0.7 and b = 0.03. The green curve shows 1/rc, where r is the number of repetitions and c = 1. The red curve is switching probability, which is the product of the previous terms.
