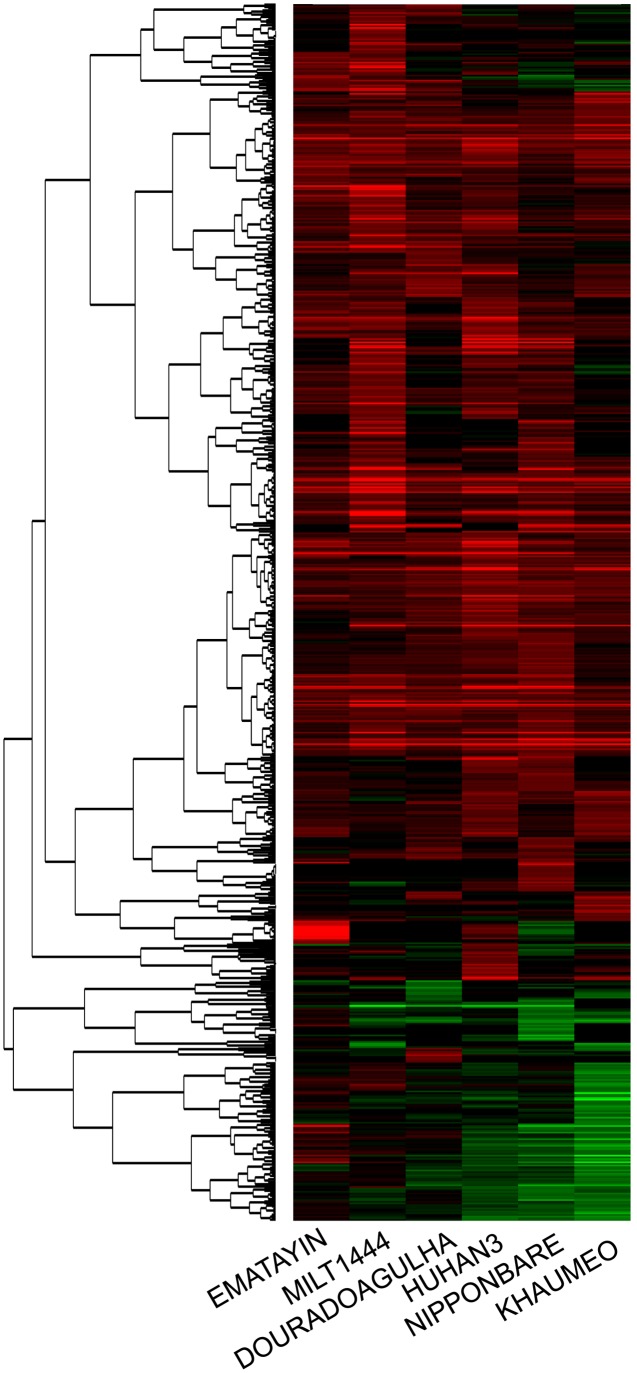
FIGURE 3.
Clustering results of differentially expressed genes in the microarray experiment. Each row represented log2-fold change of the relative gene expression. Up-regulated expression genes were colored red, down-regulated expression genes were colored green, and black represented no significant expression.

