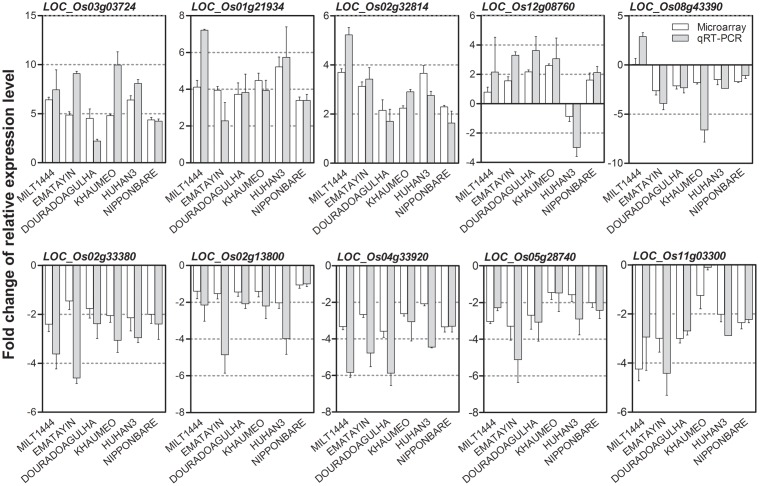
FIGURE 4.
Validation of reproducibility of drought-induced differentially expressed genes (DEGs) by qRT-PCR. Ten randomly selected DEGs were performed qRT-PCR in six rice varieties. The bar graph shows relative fold change of each gene between drought stress and well watered conditions in different comparisons (labeled below the lower panel) obtained by qRT-PCR (white bar) and microarray (gray bar). The correlation coefficient between qRT-PCR and microarray data ranged from 0.91 to 0.99 in six rice varieties.

