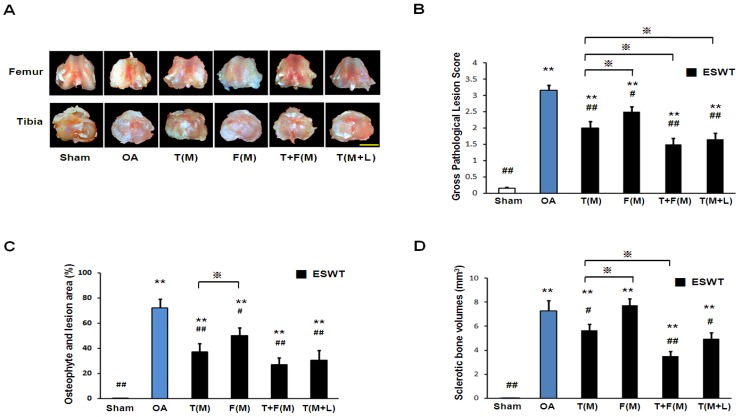
Figure 1.
The photographs showed macroscopic pathological osteoarthritic lesions of knee including the areas of osteophyte formation. (A) The knee photos demonstrated the gross pathological osteoarthritic lesions in distal femur and proximal tibia. The scale bar represented 5 mm. (B), (C) and (D) showed the gross appearance of OA lesion, osteophyte and lesion area as well as sclerotic bone volumes (n = 8 in each groups). The ESWT groups showed significantly lower lesion scores as compared to OA group and sham group. Amongst EWST groups, T+F(M) showed the lowest lesion score than other groups. **P < 0.001 compared to sham group. #P < 0.05, ##P< 0.001 compared to OA group. ※P < 0.05 compared to T(M).

