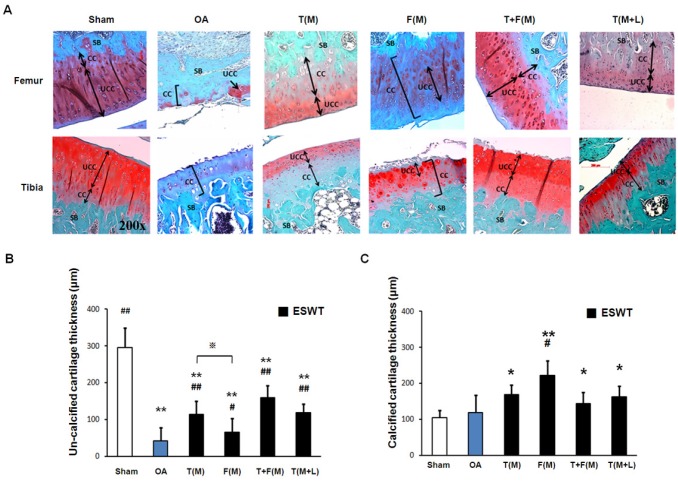
Figure 3.
The microphotographs showed un-calcified and calcified cartilages of the knee. (A) Microphotographs of the distal femur and proximal tibia showed un-calcified and calcified cartilage thickness in different groups. The magnification of the image was ×200. (B), (C) Graphic illustrations of un-calcified and calcified cartilage thickness in different groups were showed in this study. The ESWT groups showed significant increasing in un-calcified cartilage and decreasing in calcified cartilage. *P < 0.05, **P < 0.001 compared to sham group. #P < 0.05, ##P < 0.001 compared to OA group. ※P < 0.05 compared to T(M) group. All rats were n = 8.

