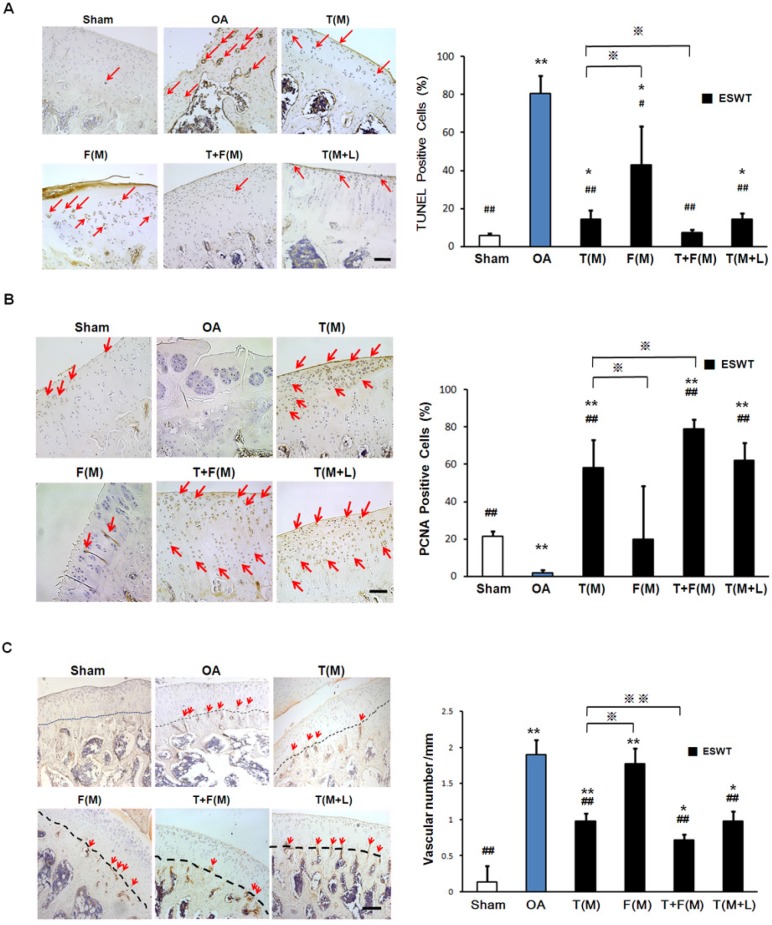
Figure 6.
Immunohistochemical analysis for molecular changes on different positions with ESWT. Microscopic features of immunohistochemical stains (left) and quantification (right) showed the effect of TUNEL assay (A) and the expression levels of PCNA (B) and CD31 (C) after ESWT on different positions. *P < 0.05, **P < 0.001 compared to sham group. #P < 0.05, ##P < 0.001 compared to OA group. ※P < 0.05, ※※P < 0.001 compared to T(M) group. All rats were n = 8. The scale bar represented 100 μm.

