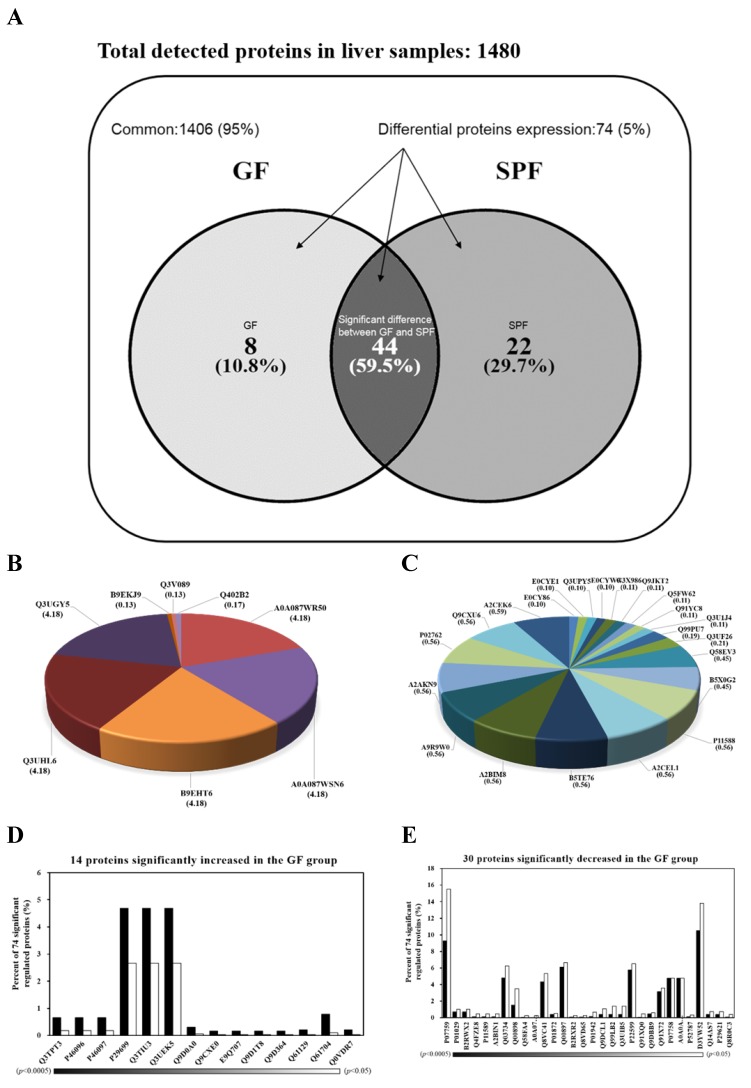
Figure 4.
Venn diagrams comparing the common, only detected, or overlap in significant regulated proteins for liver samples from SPF and GF mice. (A) There was a 95% common and a 5% significant regulated proteins between two groups. When the 95% un-changed proteins were removed and the other significant regulated proteins were normalized to 100%, there was a 10.8% unique proteins in GF mice, a 29.7% unique proteins in SPF mice, and an 59.9% overlap in significant regulated proteins between SPF mice and GF mice. (B) The percent distributions for the 8 proteins were only detected in GF mice. (C) The percent distributions for the 22 proteins were only detected in SPF mice. (D) The percent distributions for the 14 proteins were significantly increased in GF mice compared to SPF mice. (E) The percent distributions for the 30 proteins were significantly decreased in GF mice compared to SPF mice.

