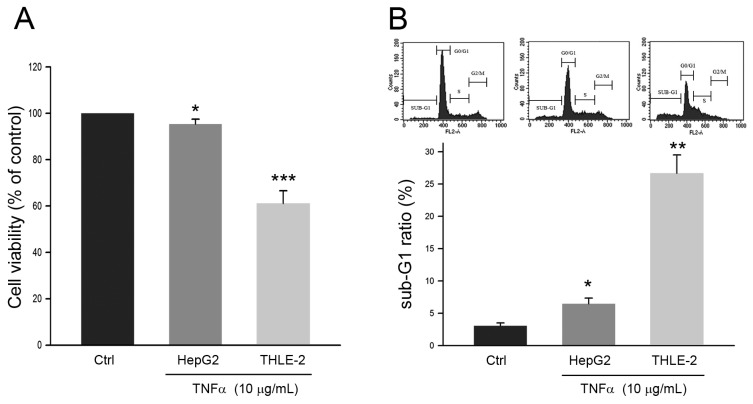
Figure 1.
Effects of TNFα on HepG2 cell and THLE-2 cell. Cells were treated with PBS (Control) or TNFα at 10 μg/mL for 24 h, and then were subject to (A) MTT assay for determining cell viability and (B) cell cycle distribution analysis for determining sub-G1 phase ratio. *, ** and ***, P <0.05, 0.01 and 0.005 as compared to control, respectively.

