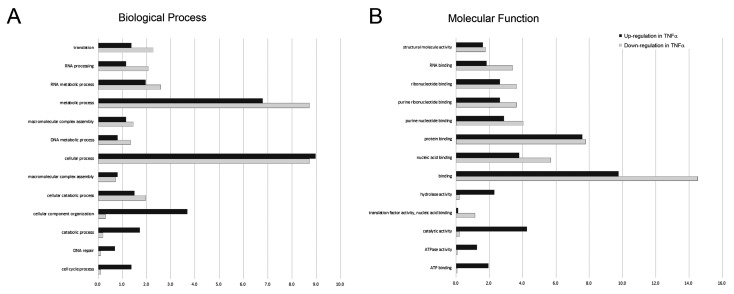
Figure 3.
Gene ontology (GO) annotations for (A) biological process and (B) molecular function of proteins with up-regulated (dark bars) and down-regulated (gray bars) expression level in response to TNFα treatment. The relative number of proteins was shown as a percentage of the total number of proteins with significantly changed in each state normalized to the total number of proteins with each annotation identified in the experiment.

