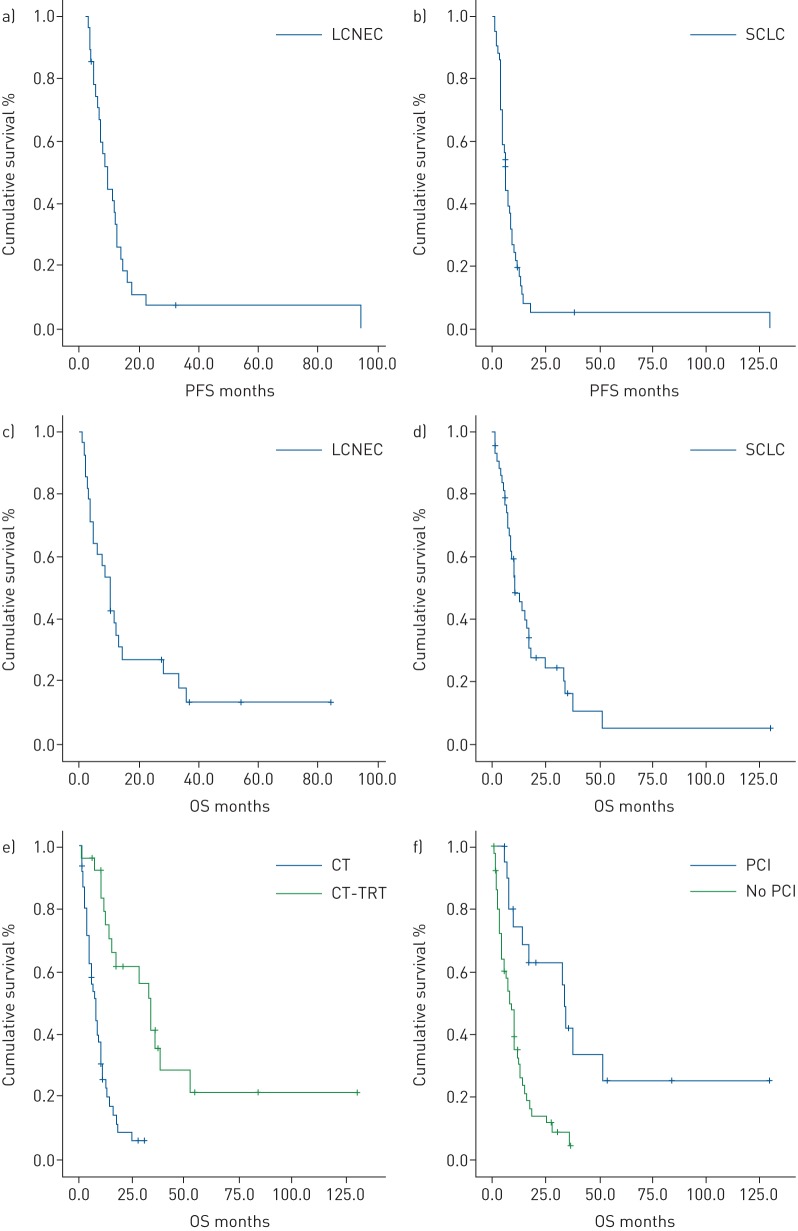
FIGURE 1.
a–d) Comparison of Kaplan–Meier curves of a) progression-free survival (PFS) and c) overall survival (OS) in large-cell neuroendocrine carcinoma (LCNEC) patients undergoing first-line therapy with cisplatin–etoposide and Kaplan–Meier curves of b) PFS and d) OS in small-cell lung cancer (SCLC) patients undergoing the same therapy. e, f) Kaplan–Meier curves for OS according to the use of e) thoracic radiotherapy (TRT) and f) prophylactic cranial irradiation (PCI) following first-line chemotherapy (CT) in high-grade neuroendocrine carcinoma patients.

