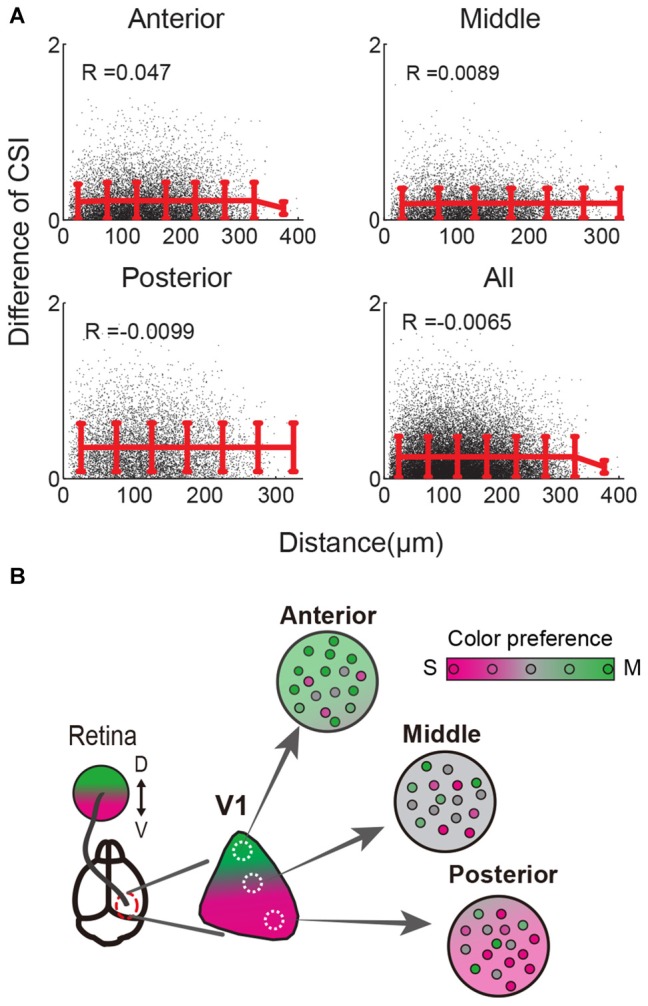
Figure 4.

Spatial distribution of color responsive neurons in the local area. (A) Distances and CSI differences of all color-responsive neuron pairs were calculated and plotted. A single black dot indicates the data for each pair. Red lines and error bars indicate the mean values and SD of black dots binned every 50 μm. Pearson’s correlation coefficients (R) are shown. The mean CSIs are almost constant independent of the distance between pairs in all three V1 regions and all data (bottom right). These results indicate that color preferences are intermingled at the single cell level within several hundred microns. (B) Scheme of local and retinotopically dependent color representation. Population average of color preference changed depending on the retinotopic position (three circles: Anterior, Middle, Posterior, indicate local area of V1, and their background colors represent local averages of color preferences). In contrast, color preferences of single neurons were variable and locally intermingled (represented by small circles in each local area). This across-cell variability is higher than change of the averaged color preference depending on the retinotopic position in the range of several hundred microns (Background color change very slightly in each local area). Thus CSI differences between cells did not depend on the distance within several hundred microns in (A).
