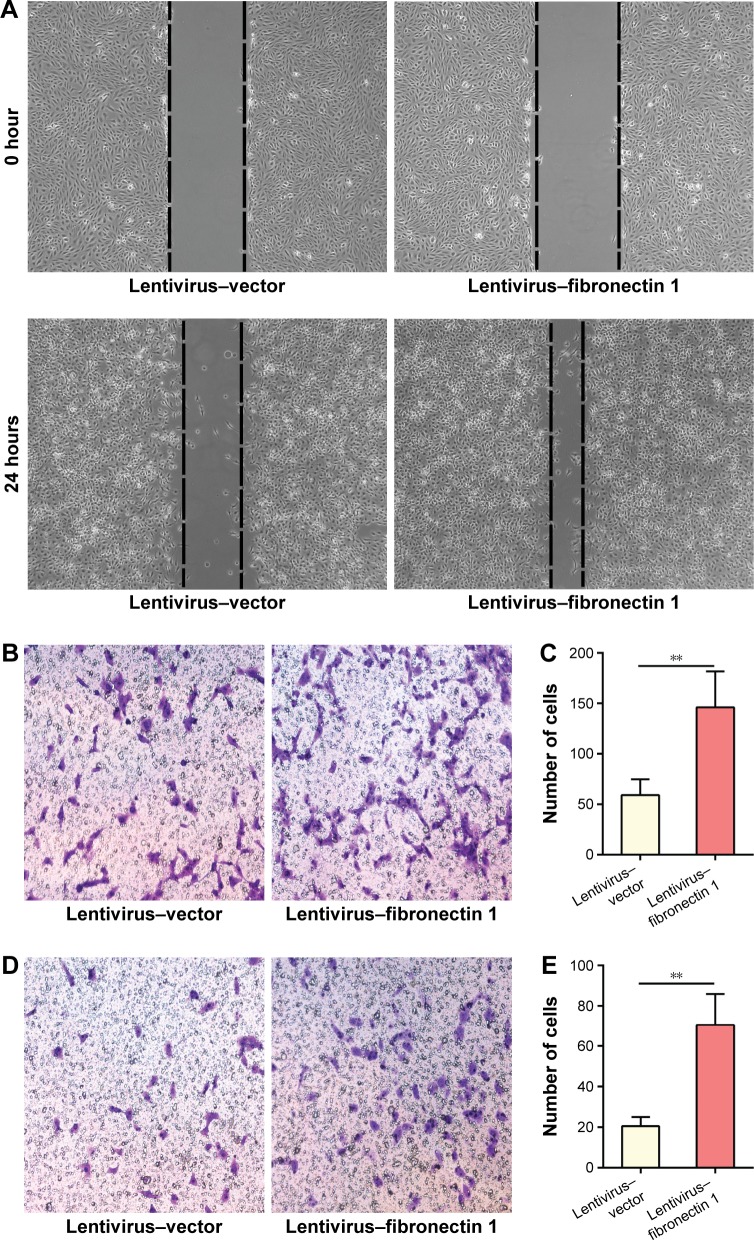
Figure 6.
Fibronectin 1 overexpression promotes the migration and invasion of TPC1.
Notes: **P<0.01. (A) Wound-healing assays were performed to determine the migration ability of TPC1 cells. Representative images at 0 and 24 hours are shown. (B) Transwell assays were performed to determine the migration ability of TPC1 cells with fibronectin 1 overexpression. Representative images of migrating cells in the lower chamber stained with crystal violet. (C) Transwell assays were performed to determine the invasion ability of TPC1 cells with fibronectin 1 overexpression. Representative images of invasive cells in the lower chamber stained with crystal violet. (D) Quantification of cell migration presented as migrated cell numbers. (E) Quantification of cell invasion presented as invasive cell numbers. All data expressed as means ± standard deviation of three independent experiments.

