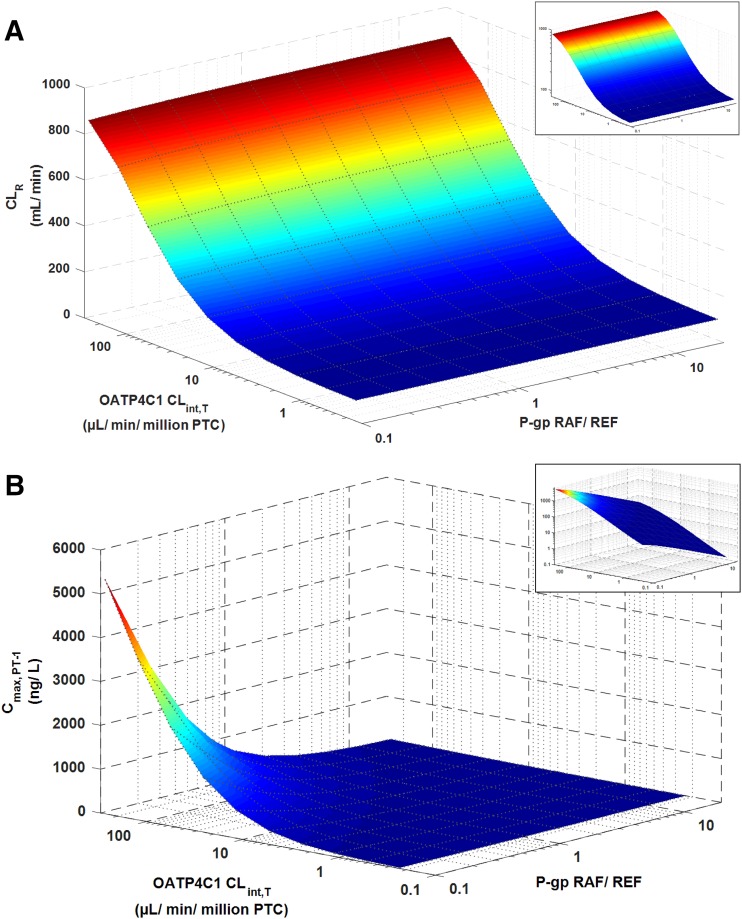
Fig. 3.
Simulated digoxin CLR (A) and Cmax, PT-1 (B) at different input values for the kidney transporter kinetic parameters. Values of OATP4C1 CLint,T and P-gp REF were varied using the automated sensitivity analysis tool in the SimCYP simulator in a population representative following the clinical trial design reported previously (Greiner et al., 1999). Insets show the graphs presented on logarithmic scales.

