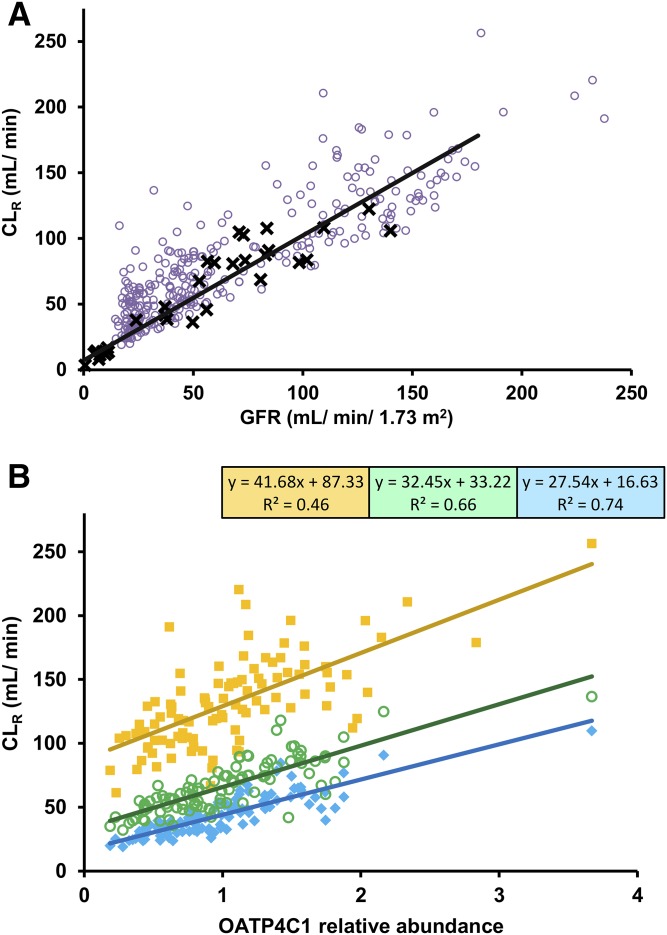
Fig. 6.
Simulated CLR in comparison with GFR and OATP4C1 abundance in virtual populations. (A) Simulated CLR and GFR data (purple open circle) in healthy and moderate and severe renal impairment virtual subjects, in comparison with reported clinical data (CLCR data on horizontal axis) (black X) (Bloom et al., 1966; Okada et al., 1978). Solid black line represents linear line of best fit using total least squares regression (which recognizes experimental error in both variables) for the observed clinical data. (B) Simulated CLR and GFR in healthy (yellow solid squares) and moderate (green open circles) and severe (turquoise solid diamond) renal impairment virtual subjects. Solid lines represent linear lines of best fit using ordinary least squares regression for data from each simulation, with relevant equations and R2 shown in boxes.

