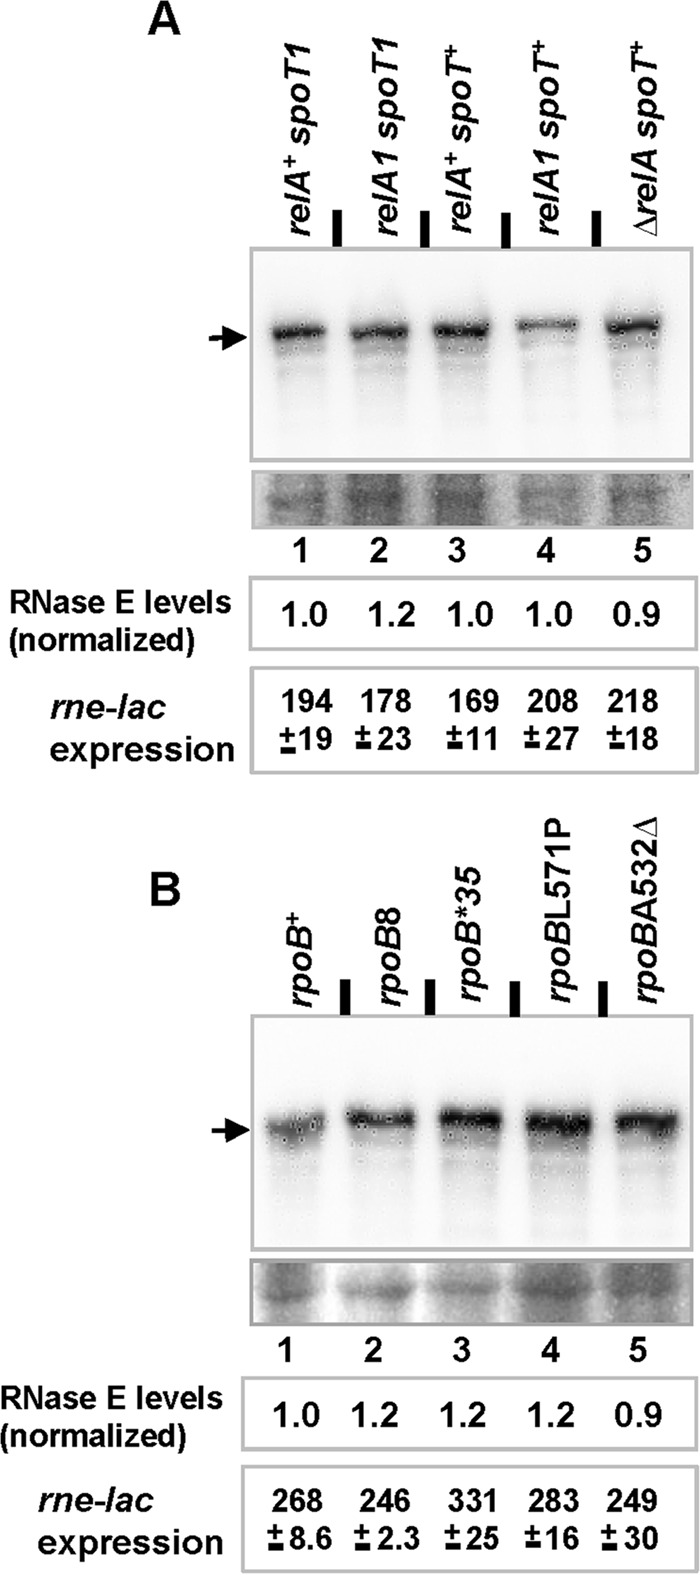
FIG 2.

Effects of basal ppGpp levels and rpoB genotype on RNase E levels and rne-lac expression. RNase E levels were determined by immunoblotting following growth to mid-log phase of cultures with either various combinations of relA and spoT alleles (A) or different rpoB alleles (B). The upper image in each panel shows the results from probing with anti-RNase E antibody, and the band for RNase E is marked by an arrow; the lower image shows a representative area from the same blot after staining with amido black to serve as a loading and transfer control. For each of the strains, RNase E levels were quantitated (average from two independent experiments) as the ratio of densitometric intensities of the band for RNase E to that of a suitable band (common to all lanes) in the loading control; further, the values have also been normalized to the ratio calculated for lane 1 in each of the two panels. rne-lac expression values (expressed in Miller units) for strains of the indicated genotypes were determined in LB-grown cultures. The strains used in these experiments are listed in Table S1 in the supplemental material.
