
Fig. 1.
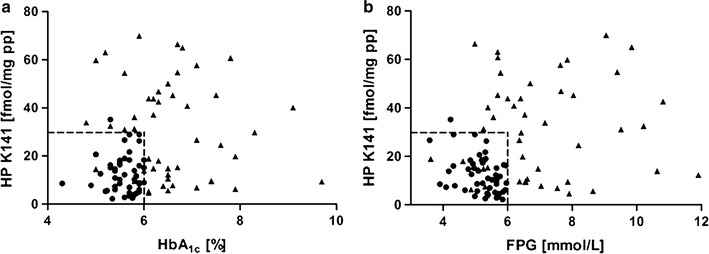
Scatter plots of HbA1c values (a) and fasting plasma glucose (FPG) levels (b) against peptide levels corresponding to Lys141 of haptoglobin (HP K141). Numerical values of 48 type 2 diabetes patients (black triangles) and 48 control persons (black circles) are shown. Dashed lines illustrate the cut point chosen for each feature