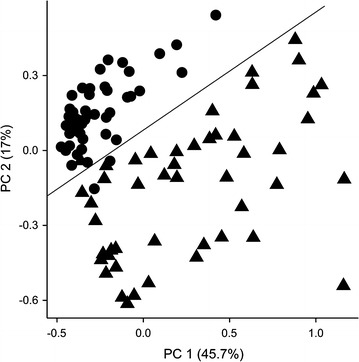
Fig. 2.

Principle component plot shows the clear separation between T2DM patients and controls using the 15 diagnostic parameters: HbA1c, fasting plasma glucose (FPG), free fatty acids (FAA), triglyceride levels, leukocytes levels, C-reactive protein levels, HOMA-IR, age, waist, waist-to-hip ratio, diastolic blood pressure, and glycated peptides 4, 8, 11, and 25 (Table 1). Values for 48 type 2 diabetes patients (black triangles) and 48 control persons (black circles) are shown. PC1 first principle component, PC2 second principle component
