
Fig. 3.
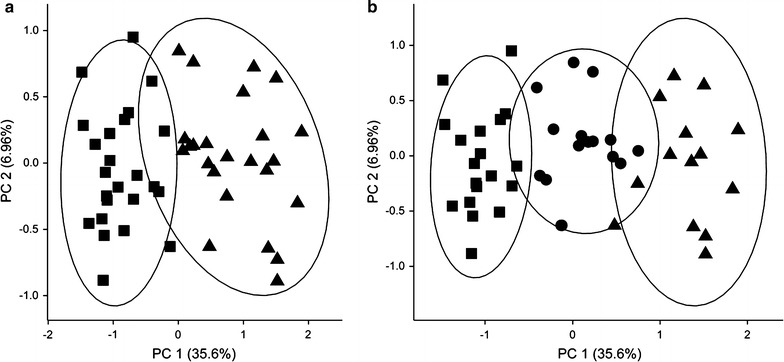
Principle component plot of the clustering of 48 T2DM patients into two (a) or three (b) clusters based on all available patient information, i.e. diagnostic parameters and glycated peptide levels. Missing values were imputed using Weka. The ellipses are drawn at 95% confidence interval using the level parameter in ggplot. PC1 first principle component, PC2 second principle component