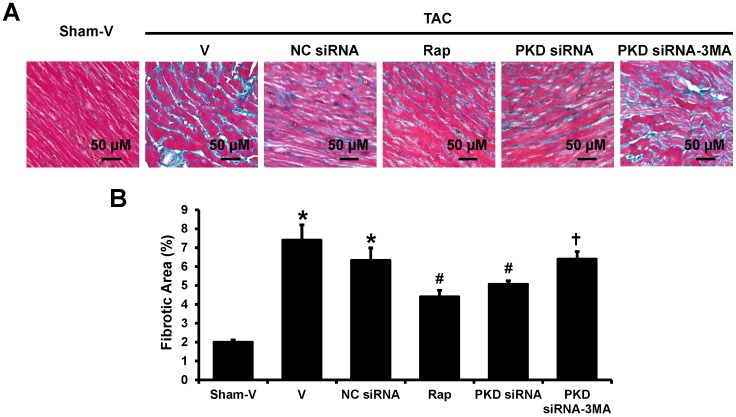
Fig 3.
Fibrosis in left ventricles. (A) Representative images of Masson's Trichrome staining in left ventricles, the blue stands for fibrosis. (B) Quantification results of the cardiac fibrosis area. TAC, transverse aorta constriction; V, vehicle; NC, negative control; Rap, rapamycin. Data are mean±SEM, n=8-9/group. * P<0.05 vs. sham; # P<0.05 vs. vehicle or NC siRNA treated TAC mice; … P<0.05 vs. TAC-PKD siRNA.

