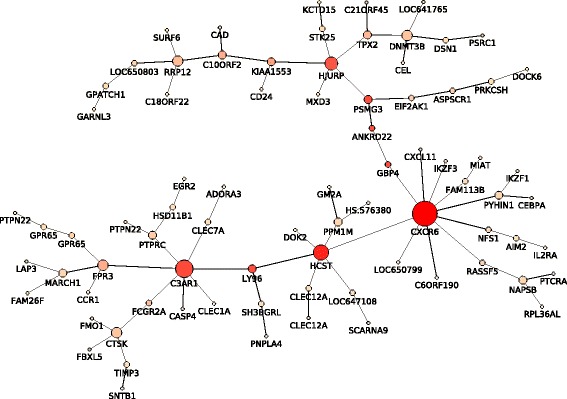
Fig. 2.

Minimum Spanning Tree of the 80-probe signature. The MST graph was generated for the 80 probes in the training set. Only probes with high correlation values between their expression levels are connected to a network. The size of each node is proportional to the computed node degree value (number of connections). The colour of each node is reflective of the betweenness centrality value ranging between low (light pink) and high (red)
