
Fig. 5.
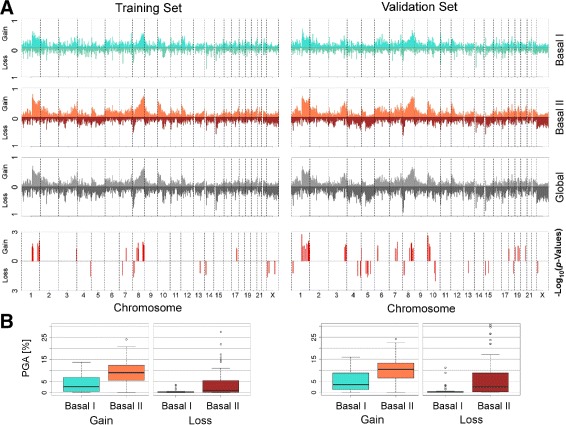
Copy number aberration defined for basal-like subgroups in the METABRIC data set. a The CNA information is plotted for 23 chromosomes (including the X chromosome); the percentage of the population showing amplification/gain (Amp) or deletion/loss (Del) were calculated for each cytoband. b The boxplots represent the PGA computed for each METABRIC data set