Fig. 1.
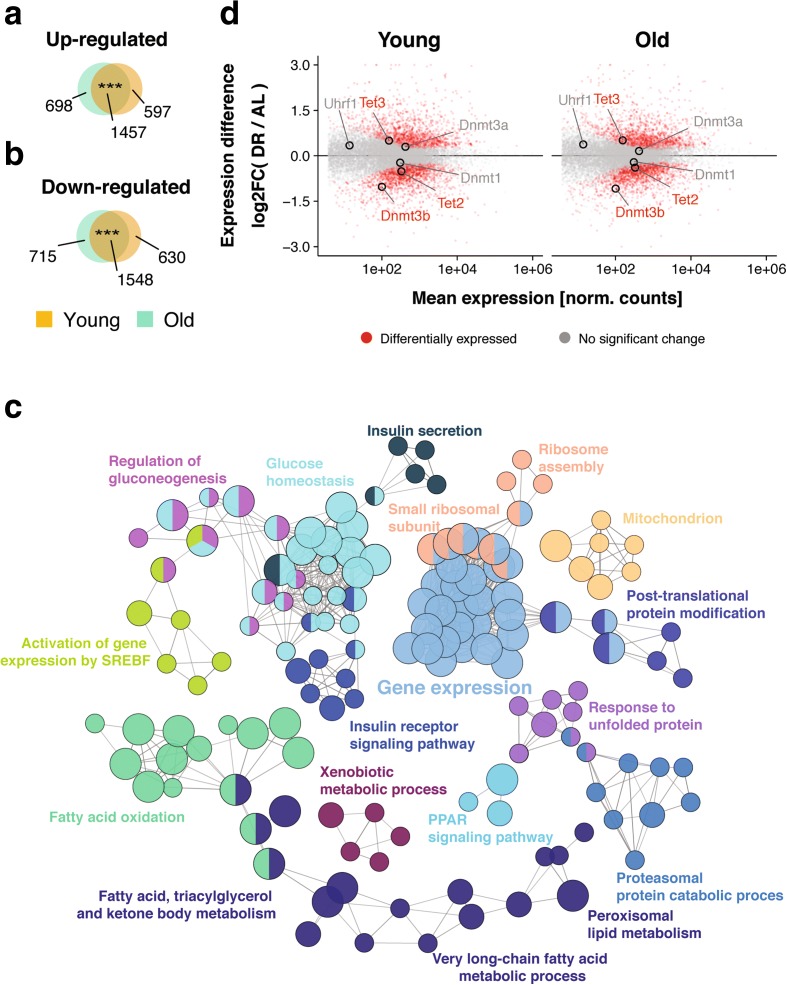
Transcriptome response to dietary restriction (DR) in the mouse liver. a, b Venn diagrams depicting the overlap of significantly upregulated (a) and downregulated (b) genes under DR relative to the ad libitum-fed (AL) control group at young and old age. *** p < 0.001, one-sided Fisher’s exact test. c Network representation of enriched gene ontology terms and pathways for genes differentially regulated under DR at both ages. Each node (circles) represents one term/pathway. Edges (lines) connect terms with similar gene sets (distance stands in inverse relationship with overlap); further functional clustering (color) was based on kappa statistics. Shown are representative terms per cluster. d MA-plots representing log2-transformed ratios of gene expression levels under DR and AL at both ages versus average expression on a logarithmic scale. Genes showing differential expression between the diets at both ages are marked in red (n = 3005). DNA de/methylation genes are highlighted

