Fig. 4.

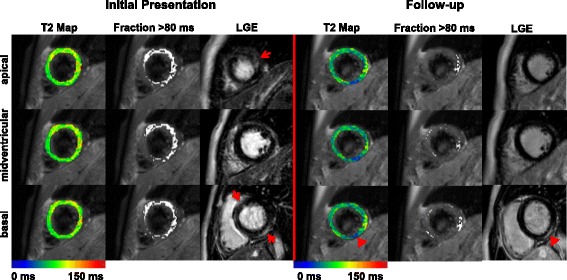
T2 Mapping and LGE at initial presentation and at follow-up. Apical, midventricular and basal short axis slices of a patient with biopsy-proven acute myocarditis are displayed at initial presentation and at 12 months follow-up. Coloured T2 maps display global T2 values in a color code ranging from 0 to 150 ms while regional T2 values exceeding 80 ms are given as white overlays. Late Gadolinium Enhancement (LGE) images are shown next to the T2 analysis in identical short axis slice. Red arrows point towards regions of LGE uptake at initial presentation. Arrowheads point towards a region with persistent LGE and with low (blue) T2 values. Abbreviations: Fraction >80 ms = Percentage of myocardial extent with T2 time >80 ms >16.8%, LGE = Late Gadolinium Enhancement
