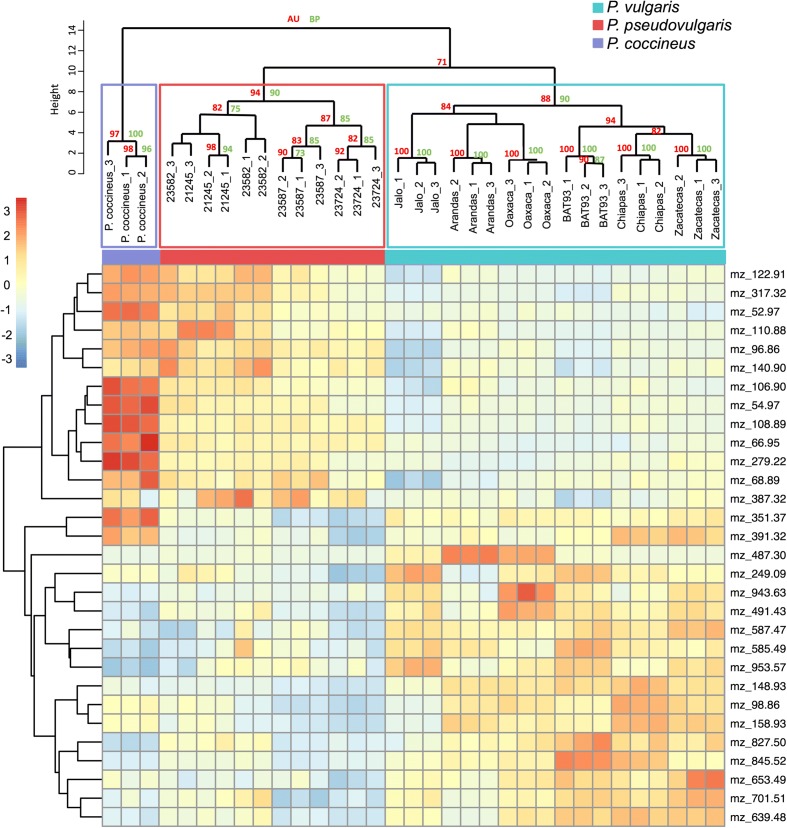
Fig. 2.
Metabolomic profiles of Phaseolus species. The heatmap shows the 30 most informative mass signals from extracts of young trifoliate leaves that explain inter-species differences between P. vulgaris, P. pseudovulgaris, and P. coccineus. The associated horizontal dendrogram reproduces the phylogeny of the accessions, while the vertical dendrogram clusters mass signals according to their abundance. Approximately unbiased probabilities (AU) and bootstrap support (BP) ≥ 70 are displayed in the horizontal dendrogram

