Figure 1.
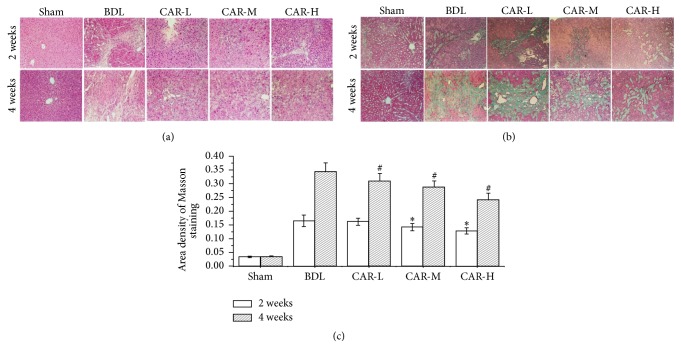
Representative photomicrographs of liver sections stained with H&E and MT, respectively. (a) H&E staining showed the pathologic changes in sham, BDL, CAR-L, CAR-M, and CAR-H groups two weeks and four weeks after bile duct ligation, respectively (magnification ×200). (b) MT staining showed the scar formation in the above five groups, respectively (magnification ×200). (c) The area density of Masson staining was significantly lower after carvedilol treatment. ∗P < 0.05 versus BDL group for 2 weeks; #P < 0.01 versus BDL group for 4 weeks. CAR-H versus CAR-L, P < 0.05.

