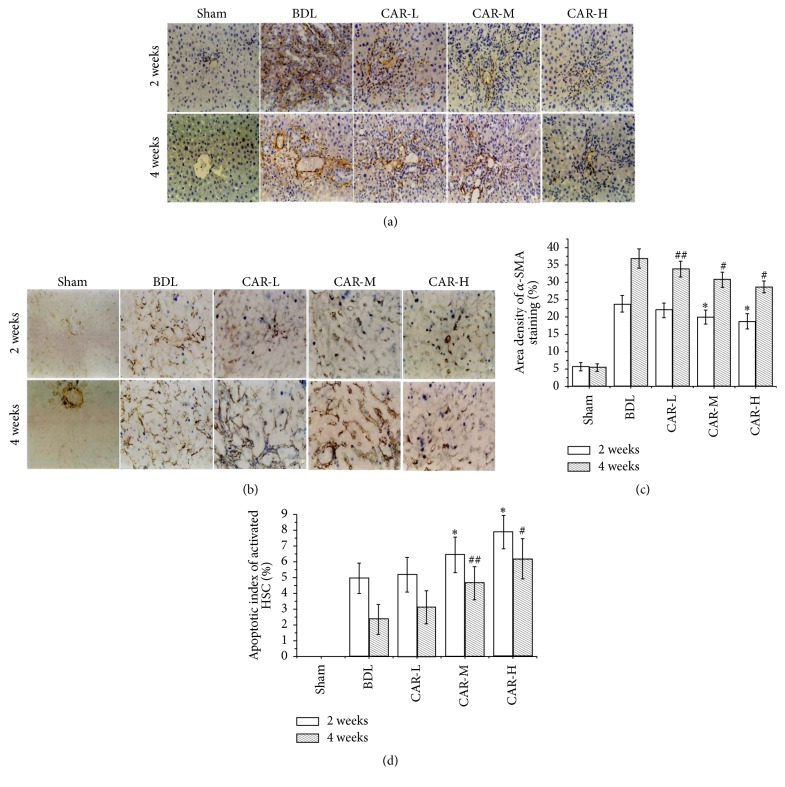
Figure 3.
α-SMA expression and the apoptotic index of activated HSC. (a, c) Expression of α-SMA by immunohistochemical staining (magnification ×200). Treatment with carvedilol was effective in inhibiting HSC activation. Moreover, it was related to the doses of the drug. ∗P < 0.01 versus BDL group for 2 weeks; ##P < 0.05, #P < 0.01 versus BDL group for 4 weeks. CAR-M versus CAR-L, P < 0.05; CAR-H versus CAR-M, P < 0.05. CAR-M versus CAR-L, P < 0.05; CAR-H versus CAR-M, P < 0.05. (b, d) Apoptosis of activated HSC by TUNEL and α-SMA immunohistochemical double staining. The apoptosis of activated HSC was markedly increased after carvedilol treatment, especially in the CAR-M and CAR-H groups. ∗P < 0.05, ∗P < 0.01 versus BDL group for 2 weeks; ##P < 0.05, #P < 0.01 versus BDL group for 4 weeks. CAR-H versus CAR-M, P < 0.05.

