
Fig. 1.
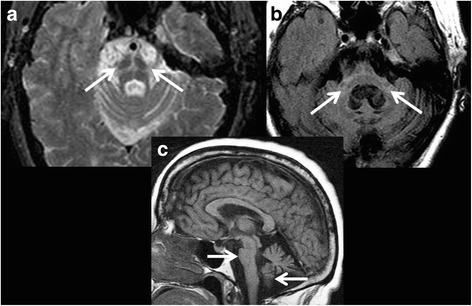
MRI of a patient with a clinical diagnosis of Multiple System Atrophy-C. a Axial proton density sequence at the level of the pons demonstrates cruciform pontine T2 hyperintensity consistent with the ‘hot cross bun’ sign secondary to selective vulnerability of the pontocerebellar tract in Multiple System Atrophy-C. Disproportionate atrophy of the pons and partially visualized cerebellar hemispheres is also evident. b Axial FLAIR sequence with cruciform T2 hyperintensity within the pons and middle cerebellar peduncles (i.e., ‘Middle Cerebellar Peduncle sign’) with marked atrophy. Cerebellar hemispheric and vermian atrophy is also seen with ex vacuo dilatation of the fourth ventricle. c Sagittal T1 sequence showing marked atrophy of the brainstem and cerebellar vermis