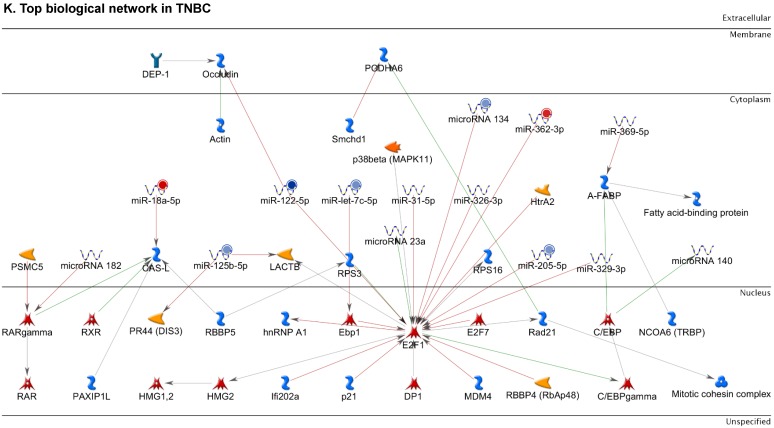
Figure 2.
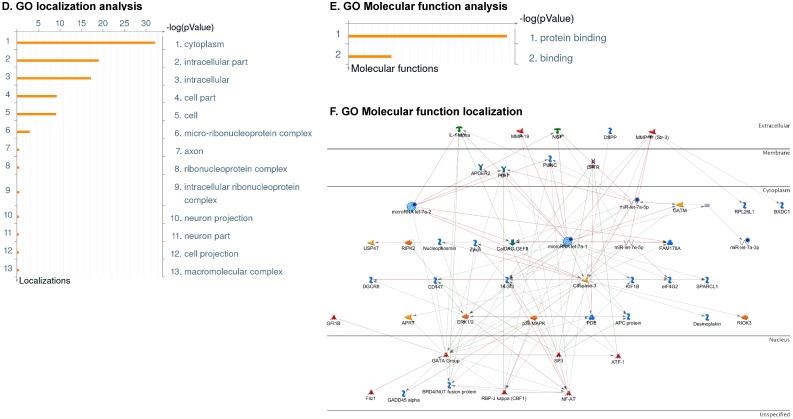
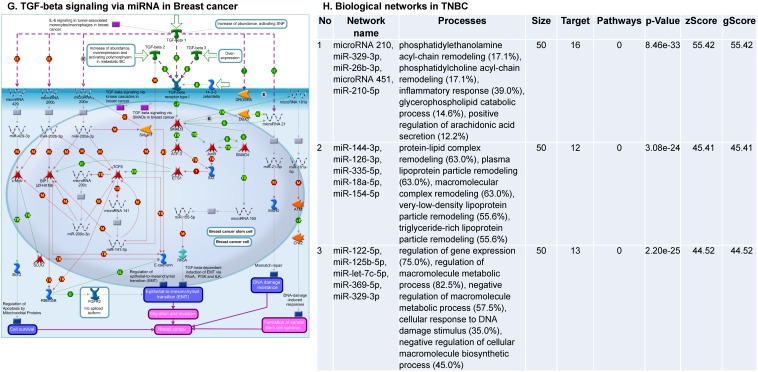
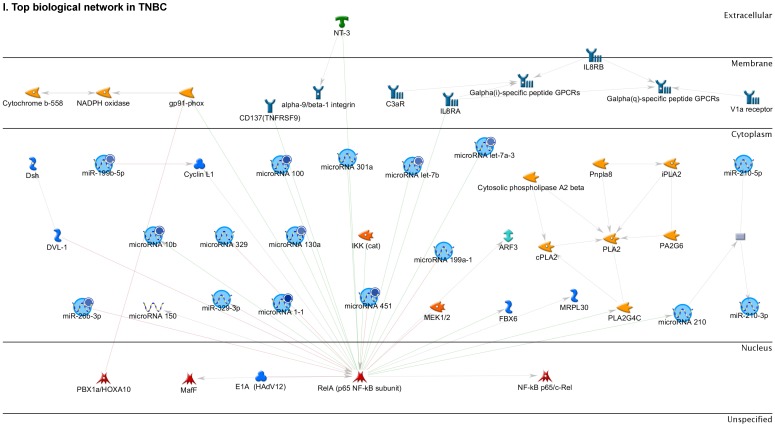
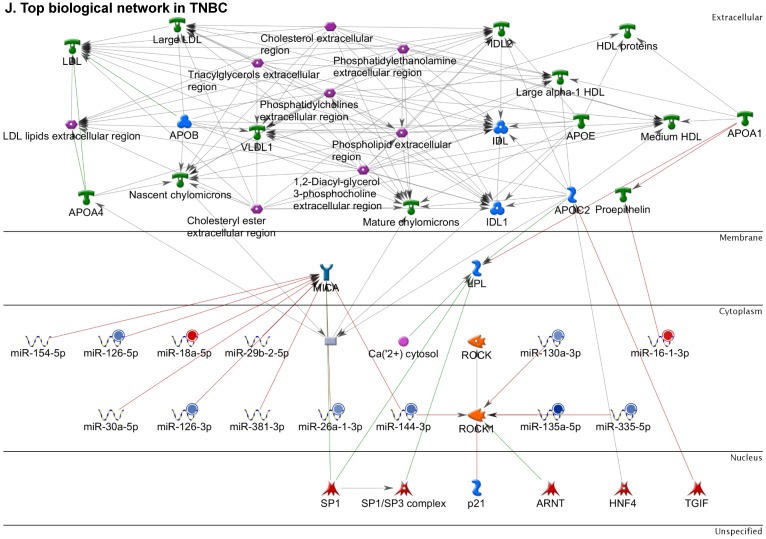
Enrichment analysis of microRNA for Pathway Maps, Gene Ontology, Disease by Biomarker and Network processes in TNBC. Pathway analysis was carried by MetaCore software, differentially expressed miRNA data were uploaded to MetaCore server and the most significantly affected pathways were created. (A): Pathway Maps: Canonical pathway analysis showed most of the miRNAs that were affected involved the oncogenic signature. (B): GO Biological Processed: The most affected Biological Processes involved stimulation of cellular responses to various substances. (C): Disease status: Significantly affected miRNAs in disease status included various carcinomas. (D): GO localization: Affected miRNA in TNBC showed localization into cytoplasm and intracellularly. (E): GO Molecular function: Protein binding was shown to be the most enriched molecular function. (F): GO Molecular function localization: miRNA data analysis for affected miRNAs distribution. (G): Enrichment analysis of top pathway: TGF-b signaling pathway involved in breast cancer, analyzed by MetaCore software, Up‑ward thermometers have red color and indicate up‑regulated signals and down‑ward (blue) ones indicate down‑regulated expression levels of the genes. (H-K): Biological network analysis: miRNA differentially expressed data were analyzed for the biological networks involved in TNBC, we presented the top three networks and involved miRs in the disease process (H). Top three regulated biological networks are shown in I, J and K. This is a variant of the shortest paths algorithm with main parameters of enrichment with enriched miRNAs prioritized based on the number of fragments of canonical pathways on the networks. Up‑regulated genes were marked with red circles; down‑regulated genes with blue circles. The 'checkerboard' color indicates mixed expression for the gene between files or between multiple tags for the same gene.


